Suzuki 2009 Annual Report Download - page 32
Download and view the complete annual report
Please find page 32 of the 2009 Suzuki annual report below. You can navigate through the pages in the report by either clicking on the pages listed below, or by using the keyword search tool below to find specific information within the annual report.-
 1
1 -
2
-
3
-
4
-
5
-
6
-
7
-
8
-
9
-
10
-
11
-
12
-
13
-
14
-
15
-
16
-
17
-
18
-
19
-
20
-
21
-
 22
22 -
 23
23 -
 24
24 -
 25
25 -
 26
26 -
 27
27 -
 28
28 -
 29
29 -
 30
30 -
 31
31 -
 32
32 -
 33
33 -
 34
34 -
 35
35 -
 36
36 -
 37
37 -
 38
38 -
 39
39 -
 40
40 -
 41
41 -
 42
42 -
43
-
44
-
45
-
46
-
47
-
48
-
49
-
50
-
51
-
52
 |
 |

SUZUKI MOTOR CORPORATION 31
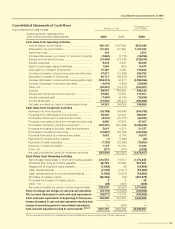
Consolidated Statements of Cash Flows
Years ended March 31, 2009 and 2008
Cash flows form operating activities
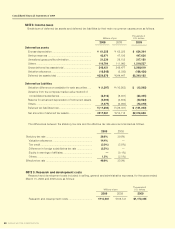
Income before income taxes ......................................... ¥80,105 ¥157,463 $815,486
Depreciation and amortization ....................................... 141,203 161,600 1,437,482
Impairment loss .............................................................. 344 —3,503
Increase (decrease) in provision for retirement benefits (3,860) (3,719) (39,296)
Interest and dividends income ...................................... (22,459) (19,003) (228,640)
Interest expenses........................................................... 9,278 9,408 94,459
Equity in (earnings) losses of affiliates ........................... 1,245 (453) 12,674
Loss (gain) on valuation of securities ............................ 27,487 8,085 279,824
Decrease (increase) in notes and accounts receivable-trade
47,617 (15,829) 484,752
Decrease (increase) in inventories ................................ 60,713 (58,003) 618,073
Increase (decrease) in notes and accounts payable-trade
(206,212) 42,871 (2,099,286)
Increase (decrease) in accrued expenses .................... (4,979) (1,966) (50,689)
Other, net ....................................................................... (62,081) (10,411) (632,001)
Subtotal 68,401 270,043 696,342
Interest and dividends income received ....................... 20,864 18,572 212,407
Interest expenses paid .................................................. (7,494) (9,105) (76,294)
Income taxes paid ......................................................... (47,530) (85,471) (483,869)
Net cash provided by (used in) operating activities 34,241 194,039 348,586
Cash flows from investment activities
Payments into time deposits........................................... (93,789) (64,840) (954,795)
Proceeds from withdrawal of time deposits ................... 55,545 63,620 565,459
Purchases of short-term investment securities............... (8,207) (55,727) (83,552)
Proceeds from sales of short-term investment securities 8,586 67,874 87,407
Purchases of property, plant and equipment ................. (202,201) (215,449) (2,058,445)
Proceeds from sales of property, plant and equipment ... 5,041 6,071 51,327
Purchases of investment securities ................................ (23,997) (28,764) (244,294)
Proceeds from sales of investment securities ................ 3,002 6,704 30,570
Payments for investments in capital ............................... (1) (7,269) (20)
Payments of loans receivable......................................... (7,728) (22,495) (78,680)
Collection of loans receivable ........................................ 1,119 35,130 11,393
Other, net ........................................................................ (277) (774) (2,826)
Net cash provided by (used in) investment activities (262,908) (215,921) (2,676,457)
Cash flows from financing activities
Net increase (decrease) in short-term loans payable 213,576 31,871 2,174,245
Proceeds from long-term loans payable ..................... 52,792 27,090 537,437
Repayment of long-term loans payable ...................... (1,963) (2) (19,986)
Cash dividends paid ................................................. (7,218) (7,211) (73,489)
Cash dividends paid to minority shareholders ......... (1,895) (2,018) (19,292)
Purchase of treasury stock ........................................ (22,384) (24) (227,878)
Proceeds from sales of treasury stock ...................... 3438
Other, net .................................................................. (39) (387) (406)
Net cash provided by (used in) financing activities 232,870 49,322 2,370,668
Effect of exchange rate changes on cash and cash equivalents
(32,775) (14,427) (333,665)
Net increase (decrease) in cash and cash equivalents (28,571) 13,013 (290,868)
Cash and cash equivalents at beginning of fiscal year 456,369 444,335 4,645,925
Increase (decrease) in cash and cash equivalents resulting from
change of accounting period of consolidated subsidiaries
—(978) —
Cash and cash equivalents at end of current period
*NOTE 10 ¥427,797 ¥456,369 $4,355,057
The accompanying Notes to Consolidated Financial Statements are an integral part of these statements.
Thousands of
U.S. dollars
SUZUKI MOTOR CORPORATION
AND CONSOLIDATED SUBSIDIARIES 2009 2008 2009
Millions of yen
Consolidated Financial Statements of 2009