Suzuki 2009 Annual Report Download - page 25
Download and view the complete annual report
Please find page 25 of the 2009 Suzuki annual report below. You can navigate through the pages in the report by either clicking on the pages listed below, or by using the keyword search tool below to find specific information within the annual report.-
 1
1 -
2
-
3
-
4
-
5
-
6
-
7
-
8
-
9
-
10
-
11
-
12
-
13
-
14
-
 15
15 -
 16
16 -
 17
17 -
 18
18 -
 19
19 -
 20
20 -
 21
21 -
 22
22 -
 23
23 -
 24
24 -
 25
25 -
 26
26 -
 27
27 -
 28
28 -
 29
29 -
 30
30 -
 31
31 -
 32
32 -
 33
33 -
 34
34 -
 35
35 -
36
-
37
-
38
-
39
-
40
-
41
-
42
-
43
-
44
-
45
-
46
-
47
-
48
-
49
-
50
-
51
-
52
 |
 |

24 SUZUKI MOTOR CORPORATION
Financial Review
(d) Asia
Sales declined to ¥752,900 million (88.9% y-o-y) on account of the exchange influences by rising yen. Operating
income declined to ¥35,320 million (62.9% y-o-y) on account of the increased raw material costs and exchange
influences.
(e) Other regions
Sales increased to ¥89,750 million (101.5% y-o-y) because of a sales increase in Africa despite sales reduction in
Oceania and Middle and South America, but operating income declined to ¥1,744 million (37.8% y-o-y) on account of
the increased operating expenses, etc.
(3) Selling, general and administrative expenses
In this fiscal year, the amount of selling, general and administrative expenses decreased by ¥109,130 million to
¥612,003 million. Because the expense of dispatch, advertising and sales promotion decreased on account of the reduced
sales.
(4) Other income and expenses
In this fiscal year, increased loss on valuation of securities were covered by interest income, foreign exchange gains
and gain on sales of noncurrent assets. However, the net amount of other income and expenses was a profit of ¥3,178
million, down ¥4,879 million from the previous fiscal year.
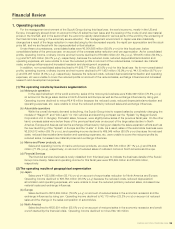
(5) Forecast of next fiscal year
The recovery of the automobile sales decline in each country is unforeseeable, but we are determined to make
concerted efforts as a group for reform in every aspect to aspire for profits on a consolidated basis.
*The business forecasts mentioned above are calculated based on currently available information and assumptions
and contain risks and uncertainty. Please note that the actual results may greatly vary by the changes of various
factors. Those factors, which may influence the actual results, include economic conditions and the trend of demand
in major markets and the fluctuation of foreign exchange rate (mainly Yen/US dollar rate, Yen/Euro rate).
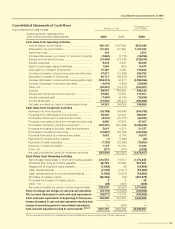
2. Liquidity and capital resources
(1) Cash flow
As for the cash flow conditions for this fiscal year, funds of ¥34,241 million was obtained from operating activities as a
result of income, depreciation/amortization and reduced inventories despite a decline in accounts payable-trade due to the
large decreased production. On the other hand, free cash flow was minus ¥228,666 million as a result of the payment of
funds of ¥262,908 million for the purchase of property, plant and equipment, etc. in the investment activities. Funds of
¥232,870 million was obtained from financing activities by the proceeds from long-term and short-term loans payable.
As a result, the balance of cash and cash equivalents at the end of this fiscal year declined to ¥427,797 million, down
¥28,571 million from the end of the previous fiscal year.
(2) Demand for money
During this fiscal year, the Company and main subsidiaries and affiliates invested a total ¥216,168 million of capital
expenditures (including ¥12,174 million of capital expenditures of main subsidiaries and affiliates) on a number of initiatives,
such as new model production, production volume increase, efficiency-enhancing and rationalization investment, R&D
investments for new models and technical innovation, distribution, sales channel and IT related investments. These
expenditures were covered by our own funds and loans payable.
Capital expenditure project for the next fiscal year is ¥185,000 million (including ¥12,000 million of capital expenditures
project of main subsidiaries and affiliates). The required fund will be covered mainly by our own funds and others.
3. Significant accounting policies
For information regarding significant accounting policies, please refer to the Notes to Consolidated Financial Statements.
FY 2009 Forecast FY 2008 Actual
Net sales ¥2,300 billion ¥3,004 billion
Operating income ¥10 billion ¥76 billion
Net income ¥5 billion ¥27 billion
Exchange rate 1 US dollar = 90 yen 1 US dollar = 101 yen
1 Euro = 115 yen 1 Euro = 144 yen