Suzuki 2009 Annual Report Download - page 29
Download and view the complete annual report
Please find page 29 of the 2009 Suzuki annual report below. You can navigate through the pages in the report by either clicking on the pages listed below, or by using the keyword search tool below to find specific information within the annual report.
28 SUZUKI MOTOR CORPORATION
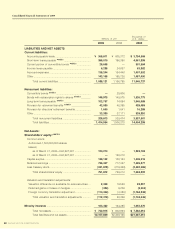
2009 2008 2009
LIABILITIES AND NET ASSETS
Current liabilities:
Accounts payable-trade ................................................. ¥ 368,811 ¥ 605,372 $ 3,754,568
Short-term loans payable *NOTE 5 ..................................... 399,010 196,390 4,061,998
Current portion of convertible bonds *NOTE 5 ................... 29,605 —301,384
Income taxes payable .................................................... 6,285 24,857 63,982
Accrued expenses ......................................................... 138,244 154,448 1,407,352
Other ............................................................................... 143,165 185,726 1,457,450
Total current liabilities ............................................. 1,085,121 1,166,795 11,046,737
Noncurrent liabilities:
Convertible bonds *NOTE 5 ................................................ —29,606 —
Bonds with subscription rights to shares *NOTE 5 ................ 149,975 149,975 1,526,773
Long-term loans payable *NOTE 5 .............................................. 102,757 74,684 1,046,089
Provision for retirement benefits *NOTE 7 ................................. 42,090 46,395 428,488
Provision for directors’ retirement benefits ..................... 1,600 1,641 16,288
Other ............................................................................... 33,390 37,171 339,920
Total noncurrent liabilities ....................................... 329,813 339,474 3,357,561
Total liabilities ......................................................... 1,414,934 1,506,270 14,404,298
Net Assets:
Shareholders’ equity:*NOTE 12
Common stock:
Authorized-1,500,000,000 shares
Issued,
as of March 31, 2009—542,647,091 ...................... 120,210 —1,223,763
as of March 31, 2008—542,647,091 ...................... —120,210 —
Capital surplus................................................................ 138,142 138,143 1,406,316
Retained earnings .......................................................... 735,337 717,357 7,485,877
Less treasury stock......................................................... (241,878) (219,499) (2,462,365)
Total shareholders’ equity ...................................... 751,812 756,212 7,653,592
Valuation and translation adjustments:
Valuation difference on available-for-sale securities ... 2,309 16,549 23,507
Deferred gains or losses on hedges ............................ (324) 9,236 (3,304)
Foreign currency translation adjustment ...................... (114,364) (3,389) (1,164,248)
Total valuation and translation adjustments ........... (112,379) 22,396 (1,144,045)
Minority interests ............................................................. 103,482 124,285 1,053,470
Total net assets ....................................................... ¥ 742,915 ¥ 902,894 $ 7,563,016
Total liabilities and net assets ................................. ¥2,157,849 ¥2,409,165 $21,967,315
Thousands of
U.S. dollars
Millions of yen
Consolidated Financial Statements of 2009


