Suzuki 2009 Annual Report Download - page 45
Download and view the complete annual report
Please find page 45 of the 2009 Suzuki annual report below. You can navigate through the pages in the report by either clicking on the pages listed below, or by using the keyword search tool below to find specific information within the annual report.-
 1
1 -
2
-
3
-
4
-
5
-
6
-
7
-
8
-
9
-
10
-
11
-
12
-
13
-
14
-
15
-
16
-
17
-
18
-
19
-
20
-
21
-
22
-
23
-
24
-
25
-
26
-
27
-
28
-
29
-
30
-
31
-
32
-
33
-
34
-
 35
35 -
 36
36 -
 37
37 -
 38
38 -
 39
39 -
 40
40 -
 41
41 -
 42
42 -
 43
43 -
 44
44 -
 45
45 -
 46
46 -
 47
47 -
 48
48 -
 49
49 -
 50
50 -
 51
51 -
 52
52
 |
 |

44 SUZUKI MOTOR CORPORATION
Millions of yen
2009
Eliminations or
Japan Europe
North America
Asia
Other areas*1
corporate assets
Consolidated
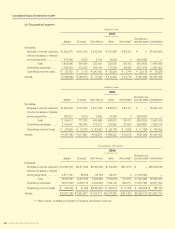
Net sales:
Net sales to external customers
¥1,345,370 ¥ 610,132 ¥ 222,285 ¥ 737,349 ¥ 89,750 ¥ — ¥3,004,888
Internal net sales or transfer
among segments ................ 478,496 8,503 3,316 15,550 0 (505,866) —
Total
1,823,866 618,636 225,601 752,900 89,750 (505,866) 3,004,888
Operating expenses .........
1,795,084 615,525 249,744 717,580 88,006 (537,979) 2,927,962
Operating income (loss) ...
¥ 28,782 ¥ 3,110 ¥ (24,143) ¥ 35,320 ¥ 1,744 ¥ 32,112 ¥ 76,926
Assets:
¥1,068,052 ¥ 180,015 ¥ 74,046 ¥ 410,050 ¥ 23,715 ¥ 401,969 ¥2,157,849
Net sales:
Net sales to external customers
¥1,405,694 ¥ 773,708 ¥ 401,230 ¥ 833,374 ¥ 88,411 ¥ — ¥3,502,419
Internal net sales or transfer
among segments ................ 788,323 3,615 4,465 13,426 0 (809,830) —
Total
2,194,017 777,323 405,696 846,801 88,411 (809,830) 3,502,419
Operating expenses .........
2,109,057 763,944 414,231 790,662 83,803 (808,685) 3,353,014
Operating income (loss) ...
¥ 84,960 ¥ 13,378 ¥ (8,535) ¥ 56,138 ¥ 4,608 ¥ (1,145) ¥ 149,405
Assets:
¥1,097,453 ¥ 317,991 ¥102,504 ¥ 499,597 ¥ 34,018 ¥357,599 ¥2,409,165
Net sales:
Net sales to external customers
$13,696,126 $6,211,265 $2,262,904 $7,506,361 $913,673 $ — $30,590,332
Internal net sales or transfer
among segments ................ 4,871,180 86,569 33,758 158,311 0 (5,149,820) —
Total
18,567,307 6,297,835 2,296,663 7,664,672 913,674 (5,149,820) 30,590,332
Operating expenses
18,274,298 6,266,170 2,542,449 7,305,101 895,917 (5,476,728) 29,807,208
Operating income (loss)
$ 293,009 $ 31,664 $(245,785) $ 359,571 $ 17,756 $ 326,908 $ 783,124
Assets:
$10,872,980 $1,832,587 $ 753,811 $4,174,386 $241,424 $4,092,123 $21,967,315
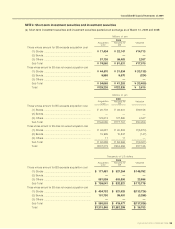
(b) Geographical segment
Thousands of U.S. dollars
2009
Elimination and
Japan Europe
North America
Asia
Other areas*1
corporate assets
Consolidated
*1 “Other areas” consists principally of Oceania and South America.
Millions of yen
2008
Elimination and
Japan Europe
North America
Asia
Other areas*1
corporate assets
Consolidated
Consolidated Financial Statements of 2009