SkyWest Airlines 2009 Annual Report Download - page 52
Download and view the complete annual report
Please find page 52 of the 2009 SkyWest Airlines annual report below. You can navigate through the pages in the report by either clicking on the pages listed below, or by using the keyword search tool below to find specific information within the annual report.-
 1
1 -
2
-
3
-
4
-
5
-
6
-
7
-
8
-
9
-
10
-
11
-
12
-
13
-
14
-
15
-
16
-
17
-
18
-
19
-
20
-
21
-
22
-
23
-
24
-
25
-
26
-
27
-
28
-
29
-
30
-
31
-
32
-
33
-
34
-
35
-
36
-
37
-
38
-
39
-
40
-
41
-
 42
42 -
 43
43 -
 44
44 -
 45
45 -
 46
46 -
 47
47 -
 48
48 -
 49
49 -
 50
50 -
 51
51 -
 52
52 -
 53
53 -
 54
54 -
 55
55 -
 56
56 -
 57
57 -
 58
58 -
 59
59 -
 60
60 -
 61
61 -
 62
62 -
63
-
64
-
65
-
66
-
67
-
68
-
69
-
70
-
71
-
72
-
73
-
74
-
75
-
76
-
77
-
78
-
79
-
80
-
81
-
82
-
83
-
84
-
85
-
86
-
87
-
88
-
89
-
90
-
91
-
92
-
93
-
94
-
95
-
96
-
97
-
98
-
99
-
100
-
101
-
102
-
103
-
104
-
105
-
106
-
107
-
108
-
109
-
110
-
111
-
112
-
113
-
114
-
115
-
116
-
117
-
118
-
119
-
120
-
121
-
122
-
123
-
124
-
125
-
126
-
127
-
128
-
129
-
130
-
131
-
132
-
133
-
134
-
135
-
136
-
137
-
138
-
139
-
140
-
141
-
142
-
143
-
144
-
145
-
146
-
147
-
148
-
149
-
150
-
151
-
152
-
153
-
154
-
155
-
156
-
157
-
158
-
159
-
160
-
161
-
162
-
163
-
164
-
165
-
166
-
167
-
168
-
169
-
170
-
171
-
172
-
173
-
174
-
175
-
176
-
177
-
178
-
179
-
180
-
181
-
182
-
183
-
184
 |
 |

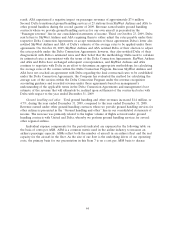
the break-up fee from Continental in June 2008. The break-up fee, net of our direct transaction costs,
was $6.3 million (pre-tax) and was recorded as other income during the year ended December 31, 2008.
Income taxes. The provision for income taxes, as a percentage of income before taxes, increased
to 36.5% in 2009 from 35.9% in 2008. The lower 2008 rate includes the impact of a decrease to the
effective state income tax rate as the result of state tax law changes in Utah and other states. The state
effective tax rate also decreased slightly from 2008 to 2009 minimizing the increase of the effective tax
rate from 2008 to 2009.
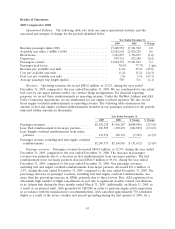
Net Income. Primarily due to factors described above, net income decreased to $83.7 million, or
$1.47 per diluted share, for the year ended December 31, 2009, compared to $112.9 million, or $1.93
per diluted share, for the year ended December 31, 2008.
2008 Compared to 2007
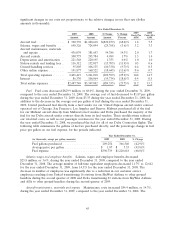
Operational Statistics. The following table sets forth our major operational statistics and the
associated percentages-of-change for the periods identified below.
Year ended December 31,
2008 2007 % Change
Revenue passenger miles (000) ........................ 17,101,910 17,892,282 (4.4)
Available seat miles (‘‘ASMs’’) (000) .................... 22,020,250 22,968,768 (4.1)
Block hours ...................................... 1,376,815 1,438,818 (4.3)
Departures ....................................... 872,288 904,795 (3.6)
Passengers carried .................................. 33,461,819 34,392,755 (2.7)
Passenger load factor ............................... 77.7% 77.9% (0.2)pts
Revenue per available seat mile ........................ 15.9¢ 14.7¢ 8.2
Cost per available seat mile ........................... 15.2¢ 13.7¢ 10.9
Fuel cost per available seat mile ....................... 5.5¢ 4.6¢ 19.6
Average passenger trip length (miles) .................... 511 520 (1.7)
Revenues. Operating revenues increased $121.9 million, or 3.6%, during the year ended
December 31, 2008, compared to the year ended December 31, 2007. We are reimbursed for our actual
fuel costs by our major partners under our contract flying arrangements. For financial reporting
purposes, we record these reimbursements as operating revenue. Under the SkyWest Airlines and ASA
Delta Connection Agreements, we are reimbursed for our engine overhaul expenses. We also record
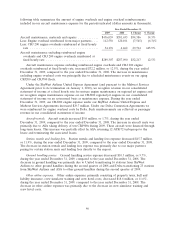
those engine overhaul reimbursements as operating revenue. The following table summarizes the
amount of fuel and engine overhaul reimbursements included in our passenger revenues for the periods
indicated (dollar amounts in thousands).
Year end December 31,
2008 2007 $ Change % Change
Passenger revenues ........................... $3,466,287 $3,342,131 $124,156 3.7%
Less: Fuel reimbursement from major partners ....... 1,185,201 1,034,630 150,571 14.6%
Less: Engine overhaul reimbursement from major
partners ................................. 120,101 67,961 52,140 76.7%
Passenger revenue excluding fuel and engine overhauls
reimbursements ............................ $2,160,985 $2,239,540 $(78,555) (3.5)%
Passenger revenues. Passenger revenues increased $124.2 million, or 3.7%, during the year ended
December 31, 2008, compared to the year ended December 31, 2007. The increase in passenger
revenues was primarily due to an increase in fuel and engine overhaul reimbursements from our major
48