SkyWest Airlines 2009 Annual Report Download - page 41
Download and view the complete annual report
Please find page 41 of the 2009 SkyWest Airlines annual report below. You can navigate through the pages in the report by either clicking on the pages listed below, or by using the keyword search tool below to find specific information within the annual report.-
 1
1 -
2
-
3
-
4
-
5
-
6
-
7
-
8
-
9
-
10
-
11
-
12
-
13
-
14
-
15
-
16
-
17
-
18
-
19
-
20
-
21
-
22
-
23
-
24
-
25
-
26
-
27
-
28
-
29
-
30
-
 31
31 -
 32
32 -
 33
33 -
 34
34 -
 35
35 -
 36
36 -
 37
37 -
 38
38 -
 39
39 -
 40
40 -
 41
41 -
 42
42 -
 43
43 -
 44
44 -
 45
45 -
 46
46 -
 47
47 -
 48
48 -
 49
49 -
 50
50 -
 51
51 -
52
-
53
-
54
-
55
-
56
-
57
-
58
-
59
-
60
-
61
-
62
-
63
-
64
-
65
-
66
-
67
-
68
-
69
-
70
-
71
-
72
-
73
-
74
-
75
-
76
-
77
-
78
-
79
-
80
-
81
-
82
-
83
-
84
-
85
-
86
-
87
-
88
-
89
-
90
-
91
-
92
-
93
-
94
-
95
-
96
-
97
-
98
-
99
-
100
-
101
-
102
-
103
-
104
-
105
-
106
-
107
-
108
-
109
-
110
-
111
-
112
-
113
-
114
-
115
-
116
-
117
-
118
-
119
-
120
-
121
-
122
-
123
-
124
-
125
-
126
-
127
-
128
-
129
-
130
-
131
-
132
-
133
-
134
-
135
-
136
-
137
-
138
-
139
-
140
-
141
-
142
-
143
-
144
-
145
-
146
-
147
-
148
-
149
-
150
-
151
-
152
-
153
-
154
-
155
-
156
-
157
-
158
-
159
-
160
-
161
-
162
-
163
-
164
-
165
-
166
-
167
-
168
-
169
-
170
-
171
-
172
-
173
-
174
-
175
-
176
-
177
-
178
-
179
-
180
-
181
-
182
-
183
-
184
 |
 |
The following terms used in this section and elsewhere in this Report have the meanings indicated
below:
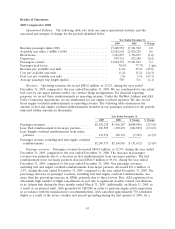
‘‘Revenue passenger miles’’ represents the number of miles flown by revenue passengers.
‘‘Available seat miles’’ represents the number of seats available for passengers multiplied by the
number of miles the seats are flown.
‘‘Revenue per available seat mile’’ represents passenger revenue divided by available seat miles.
‘‘Cost per available seat mile’’ represents operating expenses plus interest divided by available seat
miles.
ITEM 7. MANAGEMENT’S DISCUSSION AND ANALYSIS OF FINANCIAL CONDITION AND
RESULTS OF OPERATIONS
The following discussion and analysis presents factors that had a material effect on our results of
operations during the years ended December 31, 2009, 2008 and 2007. Also discussed is our financial
position as of the end of December 31, 2009 and 2008. You should read this discussion in conjunction with
our consolidated financial statements, including the notes thereto, appearing elsewhere in this Report or
incorporated herein by reference. This discussion and analysis contains forward-looking statements. Please
refer to the sections of this Report entitled ‘‘Cautionary Statement Concerning Forward-looking Statements’’
and ‘‘Item 1A. Risk Factors’’ for discussion of some of the uncertainties, risks and assumptions associated
with these statements.
Overview
Through SkyWest Airlines and ASA, we operate the largest regional airline in the United States.
As of December 31, 2009, SkyWest Airlines and ASA offered scheduled passenger and air freight
service with more than 2,300 total daily departures to 217 destinations in the United States, Canada,
Mexico and the Caribbean. Additionally, as of December 31, 2009, we provided ground handling
services for approximately 11 other airlines throughout our system. As of December 31, 2009, we
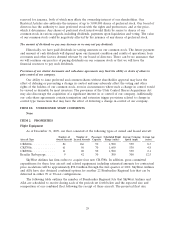
operated a combined fleet of 449 aircraft consisting of 250 CRJ200 (81 assigned to United, 164
assigned to Delta, three assigned to Midwest and two assigned to AirTran, 117 CRJ700 (66 assigned to
United and 51 assigned to Delta), 31 CRJ900s (all assigned to Delta) and 51 Brasilia turboprop (39
assigned to United and 12 assigned to Delta). We believe our success in attracting multiple contractual
relationships with our major airline partners is attributable to our delivery of high-quality customer
service with an all cabin-class fleet at a competitive cost structure. For the year ended December 31,
2009, approximately 55.8% of our aggregate capacity was operated under the Delta code, approximately
42.4% was operated under the United code, approximately 1.7% was operated under the Midwest code
and approximately 0.1% under the AirTran code.
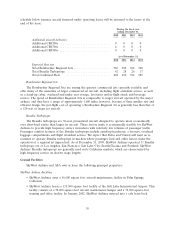
SkyWest Airlines has been a code-share partner with Delta in Salt Lake City and United in Los
Angeles since 1987 and 1997, respectively. In 1998, SkyWest Airlines expanded its relationship with
United to provide service in Portland, Seattle/Tacoma, San Francisco and additional Los Angeles
markets. In 2004, SkyWest Airlines expanded its United Express operations to provide service in
Chicago. On June 10, 2009, SkyWest Airlines and Midwest mutually agreed to terminate the service
SkyWest Airlines provided to Midwest under the Midwest Services Agreement. As a result, SkyWest
Airlines removed its remaining 12 CRJ200s from Midwest service based on the following schedule: one
aircraft was removed in each of June 2009 and July 2009, three aircraft were removed in October 2009,
two aircraft were removed in November 2009, two aircraft were removed in December 2009 and the
last three aircraft were removed in January 2010. On November 4, 2009, SkyWest Airlines entered into
a code-share agreement with AirTran. Under the terms of the code-share agreement, SkyWest Airlines
has agreed to operate five CRJ200s for AirTran under a pro-rate arrangement. SkyWest Airlines
37