SkyWest Airlines 2009 Annual Report Download - page 38
Download and view the complete annual report
Please find page 38 of the 2009 SkyWest Airlines annual report below. You can navigate through the pages in the report by either clicking on the pages listed below, or by using the keyword search tool below to find specific information within the annual report.-
 1
1 -
2
-
3
-
4
-
5
-
6
-
7
-
8
-
9
-
10
-
11
-
12
-
13
-
14
-
15
-
16
-
17
-
18
-
19
-
20
-
21
-
22
-
23
-
24
-
25
-
26
-
27
-
 28
28 -
 29
29 -
 30
30 -
 31
31 -
 32
32 -
 33
33 -
 34
34 -
 35
35 -
 36
36 -
 37
37 -
 38
38 -
 39
39 -
 40
40 -
 41
41 -
 42
42 -
 43
43 -
 44
44 -
 45
45 -
 46
46 -
 47
47 -
 48
48 -
49
-
50
-
51
-
52
-
53
-
54
-
55
-
56
-
57
-
58
-
59
-
60
-
61
-
62
-
63
-
64
-
65
-
66
-
67
-
68
-
69
-
70
-
71
-
72
-
73
-
74
-
75
-
76
-
77
-
78
-
79
-
80
-
81
-
82
-
83
-
84
-
85
-
86
-
87
-
88
-
89
-
90
-
91
-
92
-
93
-
94
-
95
-
96
-
97
-
98
-
99
-
100
-
101
-
102
-
103
-
104
-
105
-
106
-
107
-
108
-
109
-
110
-
111
-
112
-
113
-
114
-
115
-
116
-
117
-
118
-
119
-
120
-
121
-
122
-
123
-
124
-
125
-
126
-
127
-
128
-
129
-
130
-
131
-
132
-
133
-
134
-
135
-
136
-
137
-
138
-
139
-
140
-
141
-
142
-
143
-
144
-
145
-
146
-
147
-
148
-
149
-
150
-
151
-
152
-
153
-
154
-
155
-
156
-
157
-
158
-
159
-
160
-
161
-
162
-
163
-
164
-
165
-
166
-
167
-
168
-
169
-
170
-
171
-
172
-
173
-
174
-
175
-
176
-
177
-
178
-
179
-
180
-
181
-
182
-
183
-
184
 |
 |

PART II
ITEM 5. MARKET FOR REGISTRANT’S COMMON EQUITY, RELATED STOCKHOLDER
MATTERS AND ISSUER PURCHASES OF EQUITY SECURITIES
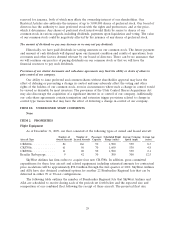
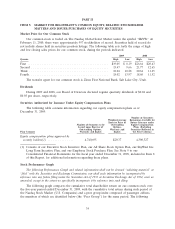
Market Price for Our Common Stock
Our common stock is traded on The Nasdaq Global Select Market under the symbol ‘‘SKYW.’’ At
February 11, 2010, there were approximately 997 stockholders of record. Securities held of record do
not include shares held in securities position listings. The following table sets forth the range of high
and low closing sales prices for our common stock, during the periods indicated.
2009 2008
Quarter High Low High Low
First .............................................. $19.05 $ 8.19 $26.64 $20.43
Second ............................................ 15.47 9.66 21.77 12.65
Third ............................................. 18.04 10.28 20.64 11.45
Fourth ............................................. 18.02 13.97 18.60 11.52
The transfer agent for our common stock is Zions First National Bank, Salt Lake City, Utah.
Dividends
During 2009 and 2008, our Board of Directors declared regular quarterly dividends of $0.04 and
$0.03 per share, respectively.
Securities Authorized for Issuance Under Equity Compensation Plans
The following table contains information regarding our equity compensation plans as of
December 31, 2009.
Number of Securities
Weighted-Average Remaining Available for
Exercise Price of Future Issuance under
Number of Securities to be Outstanding Equity Compensation
Issued upon Exercise of Options, Plans (Excluding
Outstanding Options, Warrants and Securities Reflected in
Plan Category Warrants and Rights Rights the First Column)
Equity compensation plans approved by
security holders(1) ............... 4,740,695 $20.37 4,300,327
(1) Consists of our Executive Stock Incentive Plan, our All Share Stock Option Plan, our SkyWest Inc.
Long Term Incentive Plan, and our Employee Stock Purchase Plan. See Note 9 to our
Consolidated Financial Statements for the fiscal year ended December 31, 2009, included in Item 8
of this Report, for additional information regarding these plans.
Stock Performance Graph
The following Performance Graph and related information shall not be deemed ‘‘soliciting material’’ or
‘‘filed’’ with the Securities and Exchange Commission, nor shall such information be incorporated by
reference into any future filing under the Securities Act of 1933 or Securities Exchange Act of 1934, each as
amended, except to the extent we specifically incorporate it by reference into such filing.
The following graph compares the cumulative total shareholder return on our common stock over
the five-year period ended December 31, 2009, with the cumulative total return during such period of
the Nasdaq Stock Market (U.S. Companies) and a peer group index composed of passenger airlines,
the members of which are identified below (the ‘‘Peer Group’’) for the same period. The following
34