Sears 2009 Annual Report Download - page 81
Download and view the complete annual report
Please find page 81 of the 2009 Sears annual report below. You can navigate through the pages in the report by either clicking on the pages listed below, or by using the keyword search tool below to find specific information within the annual report.-
 1
1 -
2
-
3
-
4
-
5
-
6
-
7
-
8
-
9
-
10
-
11
-
12
-
13
-
14
-
15
-
16
-
17
-
18
-
19
-
20
-
21
-
22
-
23
-
24
-
25
-
26
-
27
-
28
-
29
-
30
-
31
-
32
-
33
-
34
-
35
-
36
-
37
-
38
-
39
-
40
-
41
-
42
-
43
-
44
-
45
-
46
-
47
-
48
-
49
-
50
-
51
-
52
-
53
-
54
-
55
-
56
-
57
-
58
-
59
-
60
-
61
-
62
-
63
-
64
-
65
-
66
-
67
-
68
-
69
-
70
-
 71
71 -
 72
72 -
 73
73 -
 74
74 -
 75
75 -
 76
76 -
 77
77 -
 78
78 -
 79
79 -
 80
80 -
 81
81 -
 82
82 -
 83
83 -
 84
84 -
 85
85 -
 86
86 -
 87
87 -
 88
88 -
 89
89 -
 90
90 -
 91
91 -
92
-
93
-
94
-
95
-
96
-
97
-
98
-
99
-
100
-
101
-
102
-
103
-
104
-
105
-
106
-
107
-
108
 |
 |

SEARS HOLDINGS CORPORATION
Notes to Consolidated Financial Statements—(Continued)
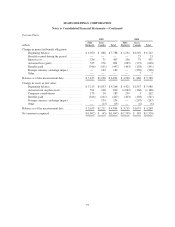
A rollforward of our Level 3 assets each year is as follows:
SHC Domestic
January 31,
2009
Balance
Net Realized and
Unrealized
Gains/(Losses)
Net Purchases,
Issuances and
Settlements
Net Transfers
Into/(Out of)
Level 3
January 30,
2010
Balance
Fixed income securities
Mortgage backed and asset backed . . . $ 42 $ 17 $ (25) $ (21) $13
Venture and partnerships ............. 138 — (89) — 49
Total Level 3 investments ............ $180 $ 17 $(114) $ (21) $62
Sears Canada
January 31,
2009
Balance
Net Realized and
Unrealized
Gains/(Losses)
Net Purchases,
Issuances and
Settlements
Net Transfers
Into/(Out of)
Level 3
January 30,
2010
Balance
Fixed income securities
Pooled equity funds ............... $409 $38 $ (63) $— $384
Corporate bonds and notes .......... 62 14 (8) — 68
Mortgage backed and asset backed . . . 4 (2) — — 2
Total Level 3 investments ............ $475 $50 $ (71) $— $454
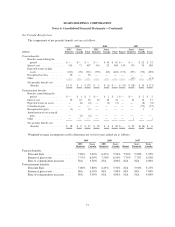
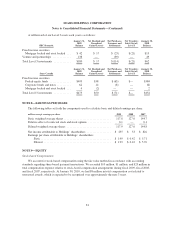
NOTE 8—EARNINGS PER SHARE
The following tables set forth the components used to calculate basic and diluted earnings per share.
millions except earnings per share 2009 2008 2007
Basic weighted average shares ................................. 117.8 127.0 144.7
Dilutive effect of restricted stock and stock options ................ 0.1 — 0.1
Diluted weighted average shares ............................... 117.9 127.0 144.8
Net income attributable to Holdings’ shareholders ................. $ 235 $ 53 $ 826
Earnings per share attributable to Holdings’ shareholders
Basic ................................................. $ 1.99 $ 0.42 $ 5.71
Diluted ............................................... $ 1.99 $ 0.42 $ 5.70
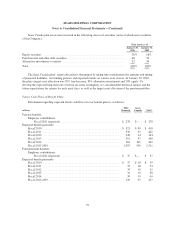
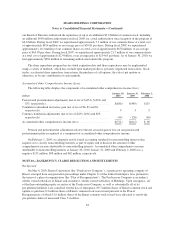
NOTE 9—EQUITY
Stock-based Compensation
We account for stock-based compensation using the fair value method in accordance with accounting
standards regarding share-based payment transactions. We recorded $10 million, $1 million, and $29 million in
total compensation expense relative to stock-based compensation arrangements during fiscal 2009, fiscal 2008,
and fiscal 2007, respectively. At January 30, 2010, we had $8 million in total compensation cost related to
nonvested awards, which is expected to be recognized over approximately the next 3 years.
81