Sears 2009 Annual Report Download - page 30
Download and view the complete annual report
Please find page 30 of the 2009 Sears annual report below. You can navigate through the pages in the report by either clicking on the pages listed below, or by using the keyword search tool below to find specific information within the annual report.
Business Segment Results
Kmart
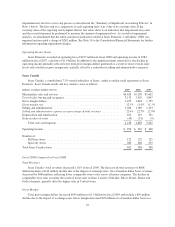
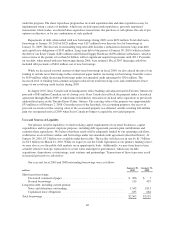
Kmart results and key statistics were as follows:
millions, except for number of stores 2009 2008 2007
Merchandise sales and services ........................................ $15,743 $16,219 $17,256
Cost of sales, buying and occupancy .................................... 12,038 12,442 13,202
Gross margin dollars ................................................ 3,705 3,777 4,054
Gross margin rate .................................................. 23.5% 23.3% 23.5%
Selling and administrative ............................................ 3,386 3,456 3,537
Selling and administrative expense as a percentage of total revenues .......... 21.5% 21.3% 20.5%
Depreciation and amortization ......................................... 152 138 116
Impairment charges ................................................. — 21 —
Gain on sales of assets ............................................... (23) (10) (1)
Total costs and expenses ......................................... 15,553 16,047 16,854
Operating income ................................................... $ 190 $ 172 $ 402
Total Kmart stores .................................................. 1,327 1,368 1,382
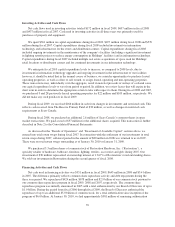
Fiscal 2009 Compared to Fiscal 2008
Total Revenues and Comparable Store Sales
Kmart’s comparable store sales and total sales declined 0.8% and 2.9%, respectively, in fiscal 2009. The
decline in total revenues primarily reflects the impact of having 41 fewer stores in operation. The 0.8% decline in
Kmart comparable store sales during fiscal 2009 was primarily driven by declines in the apparel and food and
consumables categories. This decline was partially offset by the benefit of assuming the operations of its
footwear business from a third party effective January 2009, as well as an increase in the toys category.
Gross Margin
Kmart generated $3.7 billion in gross margin in fiscal 2009 and $3.8 billion in fiscal 2008. The $72 million
decline is mainly a result of the impact of lower overall sales on Kmart’s gross margin and includes a $27 million
charge recorded in cost of sales for margin related expenses taken in connection with store closings in 2009.
Gross margin for 2008 included a charge of $15 million recorded in cost of sales for margin related expenses
taken in connection with store closings announced during that year. Kmart’s gross margin rate increased 20 basis
points to 23.5%, from 23.3% in fiscal 2008, mainly as a result of improvements in merchandise cost and reduced
clearance markdowns as a result of better inventory management.
Selling and Administrative Expenses
Kmart’s selling and administrative expenses decreased $70 million to $3.4 billion in fiscal 2009. The
decline in selling and administrative expenses primarily reflects a reduction in payroll expenses of $38 million, a
reduction in advertising expenses of $20 million, as well as reductions in various other expense categories.
Selling and administrative expenses for 2009 include charges related to store closings and severance of $35
million, as well as a $17 million gain related to settlement of Visa/MasterCard antitrust litigation. Selling and
administrative expenses for 2008 include charges of $12 million related to store closings and severance. Our
selling and administrative expense rate was 21.5% for fiscal 2009 and 21.3% in fiscal 2008, and increased
primarily as a result of the above noted significant items, as well as lower expense leverage given lower overall
sales.
30


