Sears 2009 Annual Report Download - page 27
Download and view the complete annual report
Please find page 27 of the 2009 Sears annual report below. You can navigate through the pages in the report by either clicking on the pages listed below, or by using the keyword search tool below to find specific information within the annual report.-
 1
1 -
2
-
3
-
4
-
5
-
6
-
7
-
8
-
9
-
10
-
11
-
12
-
13
-
14
-
15
-
16
-
 17
17 -
 18
18 -
 19
19 -
 20
20 -
 21
21 -
 22
22 -
 23
23 -
 24
24 -
 25
25 -
 26
26 -
 27
27 -
 28
28 -
 29
29 -
 30
30 -
 31
31 -
 32
32 -
 33
33 -
 34
34 -
 35
35 -
 36
36 -
 37
37 -
38
-
39
-
40
-
41
-
42
-
43
-
44
-
45
-
46
-
47
-
48
-
49
-
50
-
51
-
52
-
53
-
54
-
55
-
56
-
57
-
58
-
59
-
60
-
61
-
62
-
63
-
64
-
65
-
66
-
67
-
68
-
69
-
70
-
71
-
72
-
73
-
74
-
75
-
76
-
77
-
78
-
79
-
80
-
81
-
82
-
83
-
84
-
85
-
86
-
87
-
88
-
89
-
90
-
91
-
92
-
93
-
94
-
95
-
96
-
97
-
98
-
99
-
100
-
101
-
102
-
103
-
104
-
105
-
106
-
107
-
108
 |
 |
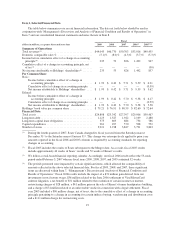
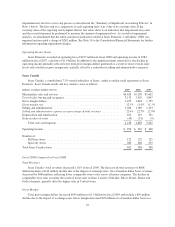
Fiscal 2008 Compared to Fiscal 2007
Net Income Attributable to Holdings’ Shareholders
Net income attributable to Holdings’ shareholders was $53 million, or $0.42 per diluted share, for the fiscal
year ended January 31, 2009 and $826 million, or $5.70 per diluted share, for the fiscal year ended February 2,
2008. Our results for fiscal 2008 and 2007 were affected by a number of significant items. Our net income, as
adjusted for these significant items, was $215 million ($1.69 per diluted share) for fiscal 2008 and $806 million
($5.56 per diluted share) for fiscal 2007. The decrease in net income in fiscal 2008 reflects a decrease in
operating income of $1.3 billion, primarily due to lower operating income at Kmart and Sears Domestic, as well
as slightly lower operating income at Sears Canada, and the above noted significant items. The decrease in net
income was also due to lower interest and investment income, partially offset by lower income tax expense.
Declines in the operating results of Sears Domestic and Kmart in 2008 were primarily the result of a decline
in gross margin across most major merchandise categories, reflecting both sales declines, as well as an overall
decline in our gross margin rate for fiscal 2008. Gross margin rate declined due to increased markdowns taken
across most merchandise categories and reduced leverage of buying and occupancy costs. During 2008, we made
a concerted effort to reduce our inventory levels due to the deterioration of the economic climate in the latter half
of 2007 and what we anticipated to be a higher risk environment in 2008.
Total Revenues and Comparable Store Sales
Total revenues were $46.8 billion for fiscal 2008 and $50.7 billion for fiscal 2007. The decline in revenues
of $3.9 billion was primarily due to a $2.5 billion decline at Sears Domestic, a $1.1 billion decline at Kmart, and
a $366 million decline at Sears Canada, which included a decrease of $96 million related to the impact of
exchange rates during fiscal 2008. Exchange rates did not have as significant an impact on the results of Sears
Canada in 2008 as compared to 2007, as rates were less volatile. The decrease in fiscal 2008 revenues was
primarily due to the impact of lower comparable store sales at Kmart and Sears Domestic.
Fiscal 2008 domestic comparable store sales were down 8.0% in the aggregate, with Sears Domestic
declining 9.5% and Kmart declining 6.1%. In fiscal 2008, declines were experienced across most major
merchandise categories. Comparable store sales declines at Sears Domestic were primarily driven by declines
recorded in the apparel, tools and lawn and garden categories, and to a lesser degree by declines in the home
appliances and household goods categories. Comparable store sales declines at Kmart were driven by declines
recorded within the apparel and home categories. We believe the overall decline in comparable store sales in
fiscal 2008 reflected the negative impact of certain external economic factors.
Gross Margin
Gross margin declined from $14.1 billion in fiscal 2007 to $12.7 billion in fiscal 2008. The decline of $1.4
billion was mainly attributable to lower gross margin dollars generated at both Kmart and Sears Domestic as a
result of the above-noted sales declines, as well as a decline in the gross margin rate. Fiscal 2008 gross margin
also includes a charge of $36 million recorded in cost of sales for margin related expenses taken in connection
with store closings announced during the third and fourth quarters of the year.
Our gross margin rate was 27.1% in fiscal 2008 and 27.7% in fiscal 2007. The 60 basis point decline
consisted of a 100 basis point decline at Sears Domestic and a 20 basis point decline at Kmart, partially offset by
an increase of 10 basis points at Sears Canada. Our buying and occupancy costs are relatively fixed in nature, and
therefore did not decrease as much as sales decreased during 2008. Reduced leverage of buying and occupancy
costs, given lower overall sales levels in fiscal 2008, accounted for approximately 20 basis points of the total
decline in our gross margin rate in fiscal 2008.
27