Sears 2009 Annual Report Download - page 72
Download and view the complete annual report
Please find page 72 of the 2009 Sears annual report below. You can navigate through the pages in the report by either clicking on the pages listed below, or by using the keyword search tool below to find specific information within the annual report.-
 1
1 -
2
-
3
-
4
-
5
-
6
-
7
-
8
-
9
-
10
-
11
-
12
-
13
-
14
-
15
-
16
-
17
-
18
-
19
-
20
-
21
-
22
-
23
-
24
-
25
-
26
-
27
-
28
-
29
-
30
-
31
-
32
-
33
-
34
-
35
-
36
-
37
-
38
-
39
-
40
-
41
-
42
-
43
-
44
-
45
-
46
-
47
-
48
-
49
-
50
-
51
-
52
-
53
-
54
-
55
-
56
-
57
-
58
-
59
-
60
-
61
-
 62
62 -
 63
63 -
 64
64 -
 65
65 -
 66
66 -
 67
67 -
 68
68 -
 69
69 -
 70
70 -
 71
71 -
 72
72 -
 73
73 -
 74
74 -
 75
75 -
 76
76 -
 77
77 -
 78
78 -
 79
79 -
 80
80 -
 81
81 -
 82
82 -
83
-
84
-
85
-
86
-
87
-
88
-
89
-
90
-
91
-
92
-
93
-
94
-
95
-
96
-
97
-
98
-
99
-
100
-
101
-
102
-
103
-
104
-
105
-
106
-
107
-
108
 |
 |

SEARS HOLDINGS CORPORATION
Notes to Consolidated Financial Statements—(Continued)
million loss in connection with our investment in The Reserve Primary Fund for the fiscal year ended January 31,
2009.
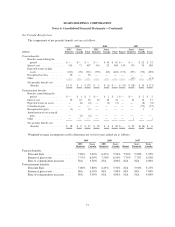
The fair values of derivative assets and liabilities traded in the over-the-counter market are determined using
quantitative models that require the use of multiple inputs including interest rates, prices and indices to generate
pricing and volatility factors. The predominance of market inputs are actively quoted and can be validated
through external sources, including brokers, market transactions and third-party pricing services. Our derivative
instruments are valued using Level 2 measurements.
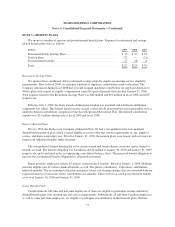
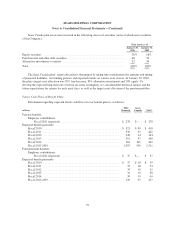
NOTE 6—INTEREST AND INVESTMENT INCOME
The following table sets forth the components of interest and investment income as reported in our
consolidated statements of income.
millions 2009 2008 2007
Interest income on cash and cash equivalents .....................................$5$25$107
Other investment income .................................................... 28 21 42
Total return swap loss ....................................................... — — (14)
Total .................................................................... $ 33 $ 46 $135
Interest Income on Cash and Cash Equivalents
We recorded interest income of $5 million, $25 million, and $107 million for fiscal 2009, fiscal 2008 and
fiscal 2007, respectively, primarily related to interest earned on cash and cash equivalents. These cash and cash
equivalents consist of highly liquid investments with original maturities of three months or less at the date of
purchase. Our invested cash may include, from time to time, investments in, but not limited to, commercial
paper, U.S. federal, state and municipal government securities, floating-rate notes, repurchase agreements and
money market funds. All invested cash amounts are readily available to us.
Other Investment Income
Other investment income primarily includes income generated by (and sales of investments in) certain real
estate joint ventures and other equity investments in which we do not have a controlling interest. Other
investment income included a $9 million, $10 million and $20 million dividend received on our cost method
investment in Sears Mexico for fiscal 2009, fiscal 2008 and fiscal 2007, respectively.
Total Return Swap Loss
As discussed above in Note 4, from time to time, we invest our surplus cash in various securities and
financial instruments, including total return swaps. During fiscal 2007, we recognized investment losses of $14
million on these total return swaps. We had no total return swaps outstanding at any time during fiscal years 2009
and 2008.
72