Sears 2009 Annual Report Download - page 38
Download and view the complete annual report
Please find page 38 of the 2009 Sears annual report below. You can navigate through the pages in the report by either clicking on the pages listed below, or by using the keyword search tool below to find specific information within the annual report.-
 1
1 -
2
-
3
-
4
-
5
-
6
-
7
-
8
-
9
-
10
-
11
-
12
-
13
-
14
-
15
-
16
-
17
-
18
-
19
-
20
-
21
-
22
-
23
-
24
-
25
-
26
-
27
-
 28
28 -
 29
29 -
 30
30 -
 31
31 -
 32
32 -
 33
33 -
 34
34 -
 35
35 -
 36
36 -
 37
37 -
 38
38 -
 39
39 -
 40
40 -
 41
41 -
 42
42 -
 43
43 -
 44
44 -
 45
45 -
 46
46 -
 47
47 -
 48
48 -
49
-
50
-
51
-
52
-
53
-
54
-
55
-
56
-
57
-
58
-
59
-
60
-
61
-
62
-
63
-
64
-
65
-
66
-
67
-
68
-
69
-
70
-
71
-
72
-
73
-
74
-
75
-
76
-
77
-
78
-
79
-
80
-
81
-
82
-
83
-
84
-
85
-
86
-
87
-
88
-
89
-
90
-
91
-
92
-
93
-
94
-
95
-
96
-
97
-
98
-
99
-
100
-
101
-
102
-
103
-
104
-
105
-
106
-
107
-
108
 |
 |
distribute. As a result, we reclassified $38 million from cash to the prepaid expenses and other current assets line
within our Consolidated Balance Sheet at January 31, 2009.
We classify outstanding checks in excess of funds on deposit within other current liabilities and reduce cash
balances when these checks clear the bank on which they were drawn. Outstanding checks in excess of funds on
deposit were $116 million and $228 million for the fiscal year ended 2009 and 2008, respectively.
Investment of Available Capital
Since the Merger, we have generated significant operating cash flows, and management expects that our
cash flows will continue to exceed our annual operating cash needs for the foreseeable future. We have and will
continue to invest in our businesses to improve the customer experience and provide the opportunity for
attractive returns. Further, as of January 30, 2010, we have repurchased approximately $5.4 billion of our
common shares since the Merger and may continue to repurchase shares subject to market conditions and board
authorization. In addition, we may pursue investments in the form of acquisitions, joint ventures and partnerships
where we believe appropriate returns can be obtained. Further, we may determine under certain market
conditions that available capital is best utilized to fund investments that we believe offer us attractive return
opportunities, whether or not related to our ongoing business activities.
Our Board of Directors has delegated authority to direct investment of our surplus cash to our Chairman,
Edward S. Lampert, subject to various limitations that have been or may be from time to time adopted by the
Board of Directors and/or Finance Committee of the Board of Directors. During fiscal 2007, we invested a
portion of our surplus cash in various securities and financial instruments, including total return swaps, which are
derivative instruments that synthetically replicate the economic return characteristics of one or more underlying
marketable equity securities. We had no investments in total return swaps during fiscal years 2009 or 2008.
Operating Activities and Cash Flows
Holdings generated $1.5 billion in operating cash flows during fiscal 2009 and $992 million in fiscal 2008.
As a retailer, Holdings’ primary source of operating cash flows is the sales of goods and services to customers,
while the primary use of cash in operations is to fund the purchase of merchandise inventories. The increase in
operating cash flows in fiscal 2009 is mainly the result of increases in cash from these sources of working capital,
as well as increased net income.
Our cash flow from operations was partially offset by the purchase of insurance coverage for workers’
compensation claims in the second and fourth quarters of 2009. We use a combination of third-party insurance
and self-insurance for our insurable risks. During 2009, we paid $126 million to purchase insurance coverage for
certain of our workers’ compensation risks from fiscal 2006 and years prior. The insurance allowed us to limit
our risk for these workers’ compensation matters, although we are not indemnified from liability for these
matters. Accordingly, the payments were recorded as deposits. These transactions also allowed us to reduce the
amount of letters of credit used as collateral for our insurance programs by $212 million. The premium payments
associated with these transactions are reported as cash used in operating activities.
Holdings generated $992 million in operating cash flows during fiscal 2008 and $1.5 billion in fiscal 2007.
The decrease in net operating cash flows generated during fiscal 2008 primarily reflects lower income, partially
offset by an increase in cash generated from inventory reductions during the year.
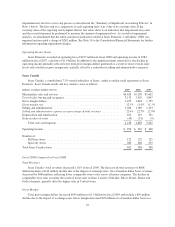
Merchandise inventories declined $90 million to $8.7 billion at January 30, 2010 from $8.8 billion at
January 31, 2009. Inventory levels at Sears Canada increased $13 million due to the impact of foreign currency
exchange rates. Merchandise payables were $3.3 billion at January 30, 2010 and $3.0 billion as of January 31,
2009. The increase in merchandise payables is reflective of improved cash management in fiscal 2009.
38