Sears 2009 Annual Report Download - page 39
Download and view the complete annual report
Please find page 39 of the 2009 Sears annual report below. You can navigate through the pages in the report by either clicking on the pages listed below, or by using the keyword search tool below to find specific information within the annual report.-
 1
1 -
2
-
3
-
4
-
5
-
6
-
7
-
8
-
9
-
10
-
11
-
12
-
13
-
14
-
15
-
16
-
17
-
18
-
19
-
20
-
21
-
22
-
23
-
24
-
25
-
26
-
27
-
28
-
 29
29 -
 30
30 -
 31
31 -
 32
32 -
 33
33 -
 34
34 -
 35
35 -
 36
36 -
 37
37 -
 38
38 -
 39
39 -
 40
40 -
 41
41 -
 42
42 -
 43
43 -
 44
44 -
 45
45 -
 46
46 -
 47
47 -
 48
48 -
 49
49 -
50
-
51
-
52
-
53
-
54
-
55
-
56
-
57
-
58
-
59
-
60
-
61
-
62
-
63
-
64
-
65
-
66
-
67
-
68
-
69
-
70
-
71
-
72
-
73
-
74
-
75
-
76
-
77
-
78
-
79
-
80
-
81
-
82
-
83
-
84
-
85
-
86
-
87
-
88
-
89
-
90
-
91
-
92
-
93
-
94
-
95
-
96
-
97
-
98
-
99
-
100
-
101
-
102
-
103
-
104
-
105
-
106
-
107
-
108
 |
 |
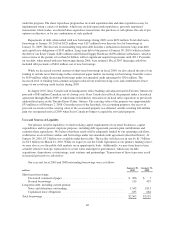
Investing Activities and Cash Flows
Net cash flows used in investing activities totaled $172 million in fiscal 2009, $637 million in fiscal 2008
and $437 million in fiscal 2007. Cash used in investing activities in all three years was primarily used for
purchases of property and equipment.
We spent $361 million on capital expenditures during fiscal 2009, $497 million during fiscal 2008 and $570
million during fiscal 2007. Capital expenditures during fiscal 2009 included investments in information
technology and infrastructure for the stores and distribution centers. Capital expenditures during fiscal 2008
included ongoing investments in the maintenance of the company’s facilities (including a significant investment
in lighting retrofit projects to reduce energy consumption in Holdings’ facilities) and in information technology.
Capital expenditures during fiscal 2007 included multiple real estate acquisitions of space used for Holdings’
retail locations or distribution centers and for continued investments in our information technology.
We anticipate fiscal 2010 capital expenditure levels to increase, as compared to 2009 levels, due to
investment in information technology upgrades and ongoing investment in the infrastructure of our facilities;
however, it should be noted that in the normal course of business, we consider opportunities to purchase leased
operating properties, as well as offers to sell owned, or assign leased, operating and non-operating properties.
These transactions may, individually or in the aggregate, result in material proceeds or outlays of cash and cause
our capital expenditure levels to vary from period to period. In addition, we review leases that will expire in the
short term in order to determine the appropriate action to take with respect to them. During fiscal 2008 and 2007,
we purchased 9 and 28 previously leased operating properties for $22 million and $109 million, respectively. We
did not make any such purchases in fiscal 2009.
During fiscal 2009, we received $166 million in cash from changes in investments and restricted cash. This
reflects cash received from The Reserve Primary Fund of $38 million, as well as changes in restricted cash
requirements at Sears Canada.
During fiscal 2008, we purchased an additional 2.6 million of Sears Canada’s common shares in open
market transactions. We paid a total of $37 million for the additional shares acquired. This transaction is further
described in Note 2 to the Consolidated Financial Statements.
As discussed in the “Results of Operations” and “Investment of Available Capital” sections above, we
entered into total return swaps during fiscal 2007. In connection with the settlement of our investments in total
return swaps during 2007, collateral posted in the amount of $80 million in 2006 was returned to us in 2007.
There were no total return swaps outstanding as of January 30, 2010 or January 31, 2009.
We purchased 5.3 million shares of common stock of Restoration Hardware, Inc. (“Restoration”), a
specialty retailer of hardware, bathware, furniture, lighting, textiles, accessories and gifts during 2007. Our
investment of $30 million represented an ownership interest of 13.67% of Restoration’s total outstanding shares.
We sold our investment in Restoration during the second quarter of fiscal 2008.
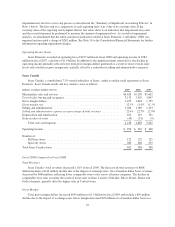
Financing Activities and Cash Flows
Net cash used in financing activities was $951 million in fiscal 2009, $643 million in 2008 and $3.4 billion
in 2007. The difference primarily reflects common share repurchase activity and debt repayments during the
three year period. We repurchased $424 million, $678 million and $2.9 billion of our common stock pursuant to
our common share repurchase program in fiscal 2009, 2008 and 2007, respectively. The common share
repurchase program was initially announced in 2005 with a total authorization by our Board of Directors of up to
$1.0 billion. During the period from fiscal 2006 through fiscal 2009, the Board of Directors authorized the
repurchase of up to an additional $5.0 billion of common stock, for a total authorization since inception of the
program of $6.0 billion. At January 30, 2010, we had approximately $581 million of remaining authorization
39