Sears 2009 Annual Report Download - page 32
Download and view the complete annual report
Please find page 32 of the 2009 Sears annual report below. You can navigate through the pages in the report by either clicking on the pages listed below, or by using the keyword search tool below to find specific information within the annual report.-
 1
1 -
2
-
3
-
4
-
5
-
6
-
7
-
8
-
9
-
10
-
11
-
12
-
13
-
14
-
15
-
16
-
17
-
18
-
19
-
20
-
21
-
 22
22 -
 23
23 -
 24
24 -
 25
25 -
 26
26 -
 27
27 -
 28
28 -
 29
29 -
 30
30 -
 31
31 -
 32
32 -
 33
33 -
 34
34 -
 35
35 -
 36
36 -
 37
37 -
 38
38 -
 39
39 -
 40
40 -
 41
41 -
 42
42 -
43
-
44
-
45
-
46
-
47
-
48
-
49
-
50
-
51
-
52
-
53
-
54
-
55
-
56
-
57
-
58
-
59
-
60
-
61
-
62
-
63
-
64
-
65
-
66
-
67
-
68
-
69
-
70
-
71
-
72
-
73
-
74
-
75
-
76
-
77
-
78
-
79
-
80
-
81
-
82
-
83
-
84
-
85
-
86
-
87
-
88
-
89
-
90
-
91
-
92
-
93
-
94
-
95
-
96
-
97
-
98
-
99
-
100
-
101
-
102
-
103
-
104
-
105
-
106
-
107
-
108
 |
 |

Impairment Charges
Kmart recorded an impairment charge of $20 million during the third quarter of fiscal 2008 in connection
with impairment testing performed in accordance with accounting standards governing the impairment or
disposal of long-lived assets. We recorded an additional impairment of $1 million during the fourth quarter of
2008 related to our decision to close additional Kmart stores in January 2009. See Note 14 to the Consolidated
Financial Statements for further information regarding impairment charges.
Operating Income
Operating income was $172 million in fiscal year 2008 and $402 million in fiscal 2007, a decline of $230
million. As discussed above, declines primarily reflect the negative gross margin impact of lower sales levels, as
well as a slight decline in Kmart’s gross margin rate in 2008. In addition to the above-noted decline in gross
margin, the decline in operating income reflects, to a lesser degree, the impact of $48 million of charges recorded
in connection with fixed asset impairments, store closings and severance in 2008.
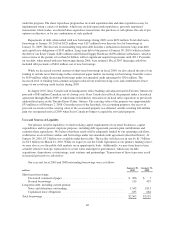
Sears Domestic
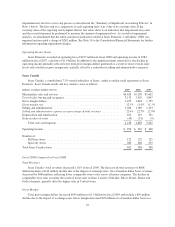
Sears Domestic results and key statistics were as follows:
millions, except for number of stores 2009 2008 2007
Merchandise sales and services ........................................ $23,672 $25,315 $27,845
Cost of sales, buying and occupancy .................................... 16,653 18,084 19,589
Gross margin dollars ................................................ 7,019 7,231 8,256
Gross margin rate .................................................. 29.7% 28.6% 29.6%
Selling and administrative ............................................ 6,220 6,415 6,698
Selling and administrative expense as a percentage of total revenues .......... 26.3% 25.3% 24.1%
Depreciation and amortization ......................................... 672 724 802
Impairment charges ................................................. — 339 —
Gain on sales of assets ............................................... (6) (10) (28)
Total costs and expenses ......................................... 23,539 25,552 27,061
Operating income (loss) .............................................. $ 133 $ (237) $ 784
Number of:
Full-line stores(1) ................................................ 908 929 935
Specialty stores ................................................. 1,284 1,233 1,150
Total Domestic Sears stores ........................................... 2,192 2,162 2,085
(1) Fiscal 2009 includes 848 full-line stores and 60 Sears Essentials/Grand stores; Fiscal 2008 includes 856 full-
line stores and 73 Sears Essentials/Grand stores; Fiscal 2007 includes 860 full-line stores and 75 Sears
Essentials/Grand stores
Fiscal 2009 Compared to Fiscal 2008
Total Revenues and Comparable Store Sales
Sears Domestic’s comparable store sales and total sales declined 8.7% and 6.5%, respectively, during fiscal
2009. The decline in total revenues primarily reflects the impact of lower comparable store sales and includes the
impact of having 21 fewer full-line stores in operation. Comparable store sales declines were driven by decreases
in the home appliance, lawn & garden, and home electronics categories.
32