Samsung 2003 Annual Report Download - page 63
Download and view the complete annual report
Please find page 63 of the 2003 Samsung annual report below. You can navigate through the pages in the report by either clicking on the pages listed below, or by using the keyword search tool below to find specific information within the annual report.-
 1
1 -
2
-
3
-
4
-
5
-
6
-
7
-
8
-
9
-
10
-
11
-
12
-
13
-
14
-
15
-
16
-
17
-
18
-
19
-
20
-
21
-
22
-
23
-
24
-
25
-
26
-
27
-
28
-
29
-
30
-
31
-
32
-
33
-
34
-
35
-
36
-
37
-
38
-
39
-
40
-
41
-
42
-
43
-
44
-
45
-
46
-
47
-
48
-
49
-
50
-
51
-
52
-
 53
53 -
 54
54 -
 55
55 -
 56
56 -
 57
57 -
 58
58 -
 59
59 -
 60
60 -
 61
61 -
 62
62 -
 63
63 -
 64
64 -
 65
65 -
 66
66 -
 67
67 -
 68
68 -
 69
69 -
 70
70 -
 71
71 -
 72
72
 |
 |

63
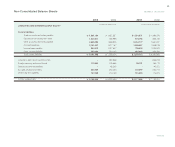
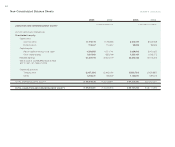
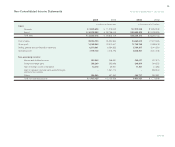
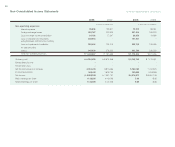
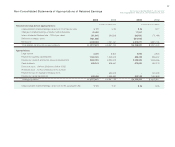
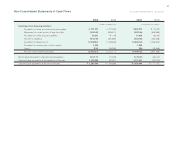
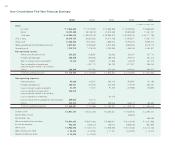
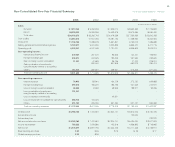
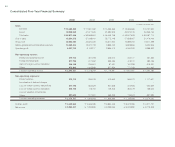
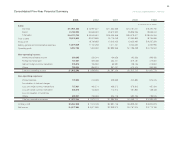
Non-Consolidated Five-Year Financial Summary
$ 7,810,048 $ 9,252,348 $ 7,926,014 $ 8,660,353 $ 7,729,803
28,599,322 24,008,395 16,493,575 18,570,586 15,080,490
$ 36,409,370 $ 33,260,743 $ 24,419,589 $ 27,230,939 $ 22,810,293
24,660,612 21,972,065 18,487,732 17,468,926 15,424,604
11,748,758 11,288,678 5,931,857 9,762,013 7,385,689
5,739,817 5,041,230 4,200,836 3,856,410 3,471,715
6,008,941 6,247,448 1,731,021 5,905,603 3,913,974
209,027 207,670 95,365 124,247 198,900
246,674 244,525 180,429 237,546 233,600
11,207 47,583 35,736 27,102 228,311
-892,040 591,848 692,079 260,474
464,717 382,581 469,551 515,843 517,444
$ 931,625 $ 1,774,399 $ 1,372,929 $ 1,596,817 1,438,729
79,913 83,961 154,709 272,730 629,868
297,216 186,220 183,196 221,643 244,970
28,556 14,659 68,999 188,911 93,096
191,241 -- --
40,821
283,748 100,426 - - -
291,730 226,000 331,484 507,131 634,353
$ 1,172,404 $ 611,266 $ 779,209 $ 1,190,415 $ 1,602,287
$ 5,768,162 $ 7,410,581 $ 2,324,741 $ 6,312,005 $ 3,750,416
- 122,029 -
--232,540
$ 5,768,162 $ 7,410,581 $ 2,324,741 $ 6,434,034 $ 3,517,876
789,885 1,519,386 102,316 1,656,806 $ 748,965
$ 4,978,277 $ 5,891,195 $ 2,222,425 $ 4,777,228 $ 2,768,911
$ 30 $ 35 $ 13 $ 28 $ 17
$ 30 $ 35 - - -
In thousands of U.S. dollars
2003 2002 2001 2000 1999
Sales:
Domestic
Export
Total sales
Cost of sales
Gross profit
Selling, general and administrative expenses
Operating profit
Non-operating income:
Interest and dividend income
Foreign exchange gain
Gain on foreign currency translation
Gain on valuation of investments
using the equity method of accounting
Others
Total non-operating income
Non-operating expenses:
Interest expense
Foreign exchange loss
Loss on foreign currency translation
Loss on valuation of investments
using the equity method of accounting
Loss on valuation of inventories
Loss on impairment of available-for-sale securities
Others
Total non-operating expenses
Ordinary profit
Extraordinary income
Extraordinary loss
Net income before income taxes
Income tax expense
Net income
Basic earnings per share
Diluted earnings per share
For the years ended December 31, 1999-2003