Samsung 2003 Annual Report Download - page 56
Download and view the complete annual report
Please find page 56 of the 2003 Samsung annual report below. You can navigate through the pages in the report by either clicking on the pages listed below, or by using the keyword search tool below to find specific information within the annual report.-
 1
1 -
2
-
3
-
4
-
5
-
6
-
7
-
8
-
9
-
10
-
11
-
12
-
13
-
14
-
15
-
16
-
17
-
18
-
19
-
20
-
21
-
22
-
23
-
24
-
25
-
26
-
27
-
28
-
29
-
30
-
31
-
32
-
33
-
34
-
35
-
36
-
37
-
38
-
39
-
40
-
41
-
42
-
43
-
44
-
45
-
 46
46 -
 47
47 -
 48
48 -
 49
49 -
 50
50 -
 51
51 -
 52
52 -
 53
53 -
 54
54 -
 55
55 -
 56
56 -
 57
57 -
 58
58 -
 59
59 -
 60
60 -
 61
61 -
 62
62 -
 63
63 -
 64
64 -
 65
65 -
 66
66 -
67
-
68
-
69
-
70
-
71
-
72
 |
 |

56
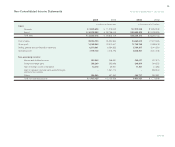
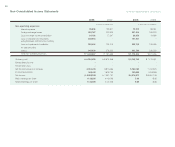
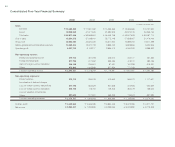
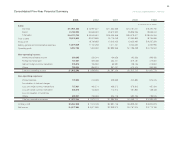
Non-Consolidated Income Statements
95,656 100,501 79,913 83,961
355,767 222,905 297,216 186,220
34,182 17,547 28,556 14,659
228,916 -191,241 -
339,646 120,210 283,748 100,426
349,200 270,522 291,730 226,000
₩1,403,367 ₩731,685 $ 1,172,404 $ 611,266
₩6,904,490 ₩8,870,466 $ 5,768,162 $ 7,410,581
----
----
6,904,490 8,870,466 5,768,162 7,410,581
945,492 1,818,705 789,885 1,519,386
₩5,958,998 ₩7,051,761 $ 4,978,277 $ 5,891,195
₩36,356 ₩42,005 $ 30 $ 35
₩35,930 ₩41,603 $ 30 $ 35
Non-operating expenses:
Interest expense
Foreign exchange losses
Loss on foreign currency translation
Loss on valuation of investments
using the equity method of accounting
Loss on impairment of available-
for-sale securities
Others
Total non-operating expenses
Ordinary profit
Extraordinary income
Extraordinary loss
Net income before income taxes
Income tax expense
Net income
Basic earnings per share
Diluted earnings per share
In millions of Korean won In thousands of U.S.dollars
2003 2002 2003 2002
For the years ended December 31, 2003 and 2002