Samsung 2003 Annual Report Download - page 59
Download and view the complete annual report
Please find page 59 of the 2003 Samsung annual report below. You can navigate through the pages in the report by either clicking on the pages listed below, or by using the keyword search tool below to find specific information within the annual report.-
 1
1 -
2
-
3
-
4
-
5
-
6
-
7
-
8
-
9
-
10
-
11
-
12
-
13
-
14
-
15
-
16
-
17
-
18
-
19
-
20
-
21
-
22
-
23
-
24
-
25
-
26
-
27
-
28
-
29
-
30
-
31
-
32
-
33
-
34
-
35
-
36
-
37
-
38
-
39
-
40
-
41
-
42
-
43
-
44
-
45
-
46
-
47
-
48
-
 49
49 -
 50
50 -
 51
51 -
 52
52 -
 53
53 -
 54
54 -
 55
55 -
 56
56 -
 57
57 -
 58
58 -
 59
59 -
 60
60 -
 61
61 -
 62
62 -
 63
63 -
 64
64 -
 65
65 -
 66
66 -
 67
67 -
 68
68 -
 69
69 -
70
-
71
-
72
 |
 |
59
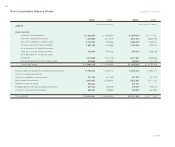
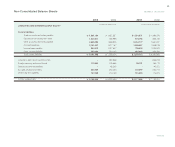
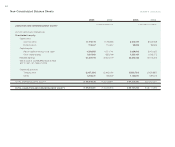
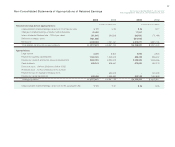
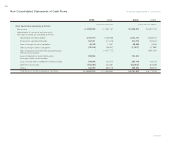
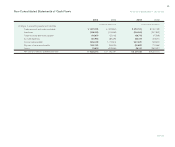
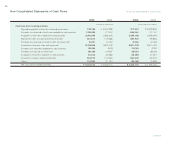
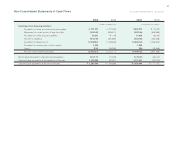
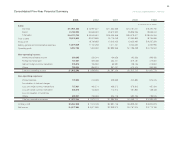
Non-Consolidated Statements of Cash Flows
₩(347,302)₩(182,864) $ (290,144)$ (152,769)
(366,962)(416,368)(306,568)(347,843)
199,654 129,143 166,795 107,889
281,988 486,295 235,579 406,261
(344,043)1,178,914 (287,421)984,891
(103,757)(86,849)(86,681)(72,556)
33,695 (423,656)28,151 (353,931)
₩9,848,418 ₩11,193,197 $ 8,227,584 $ 9,351,041
Changes in operating assets and liabilities:
Trade accounts and notes receivable
Inventories
Trade accounts and notes payable
Accrued expenses
Income taxes payable
Payment of severance benefits
Others
Net cash provided by operating activities
Continued;
In millions of Korean won In thousands of U.S.dollars
2003 2002 2003 2002
For the years ended December 31, 2003 and 2002