Samsung 2003 Annual Report Download - page 54
Download and view the complete annual report
Please find page 54 of the 2003 Samsung annual report below. You can navigate through the pages in the report by either clicking on the pages listed below, or by using the keyword search tool below to find specific information within the annual report.-
 1
1 -
2
-
3
-
4
-
5
-
6
-
7
-
8
-
9
-
10
-
11
-
12
-
13
-
14
-
15
-
16
-
17
-
18
-
19
-
20
-
21
-
22
-
23
-
24
-
25
-
26
-
27
-
28
-
29
-
30
-
31
-
32
-
33
-
34
-
35
-
36
-
37
-
38
-
39
-
40
-
41
-
42
-
43
-
 44
44 -
 45
45 -
 46
46 -
 47
47 -
 48
48 -
 49
49 -
 50
50 -
 51
51 -
 52
52 -
 53
53 -
 54
54 -
 55
55 -
 56
56 -
 57
57 -
 58
58 -
 59
59 -
 60
60 -
 61
61 -
 62
62 -
 63
63 -
 64
64 -
65
-
66
-
67
-
68
-
69
-
70
-
71
-
72
 |
 |
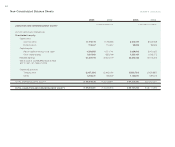
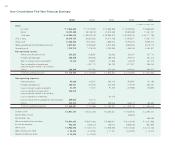
54
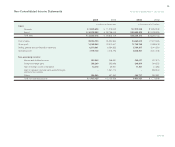
₩775,774 ₩769,680 $ 648,099 $ 643,008
119,467 119,467 99,805 99,805
4,356,898 4,071,741 3,639,848 3,401,622
1,861,920 1,853,166 1,555,489 1,548,175
24,409,709 20,320,719 20,392,405 16,976,373
(3,457,834)(2,462,091)(2,888,750)(2,056,885)
1,348,541 466,259 1,126,601 389,523
₩29,414,475 ₩25,138,941 $ 24,573,497 $ 21,001,621
₩39,203,381 ₩34,439,600 $ 32,751,363 $ 28,771,595
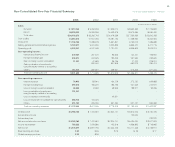
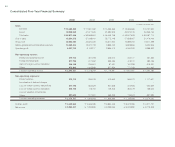
Non-Consolidated Balance Sheets
In millions of Korean won In thousands of U.S.dollars
2003 2002 2003 2002
LIABILITIES AND SHAREHOLDERS’ EQUITY
Commitments and contingencies
Shareholder’s equity:
Capital stock:
Common stock
Preferred stock
Capital surplus:
Paid-in capital in excess of par value
Other capital surplus
Retained earnings:
(Net income of ₩5,958,998 million in 2003
and ₩7,051,761 million in 2002)
Capital adjustments:
Treasury stock
Others
TOTAL SHAREHOLDERS’ EQUITY
TOTAL LIABILITIES AND SHAREHOLDERS’ EQUITY
December 31, 2003 and 2002