Samsung 2003 Annual Report Download - page 61
Download and view the complete annual report
Please find page 61 of the 2003 Samsung annual report below. You can navigate through the pages in the report by either clicking on the pages listed below, or by using the keyword search tool below to find specific information within the annual report.-
 1
1 -
2
-
3
-
4
-
5
-
6
-
7
-
8
-
9
-
10
-
11
-
12
-
13
-
14
-
15
-
16
-
17
-
18
-
19
-
20
-
21
-
22
-
23
-
24
-
25
-
26
-
27
-
28
-
29
-
30
-
31
-
32
-
33
-
34
-
35
-
36
-
37
-
38
-
39
-
40
-
41
-
42
-
43
-
44
-
45
-
46
-
47
-
48
-
49
-
50
-
 51
51 -
 52
52 -
 53
53 -
 54
54 -
 55
55 -
 56
56 -
 57
57 -
 58
58 -
 59
59 -
 60
60 -
 61
61 -
 62
62 -
 63
63 -
 64
64 -
 65
65 -
 66
66 -
 67
67 -
 68
68 -
 69
69 -
 70
70 -
 71
71 -
72
 |
 |
61
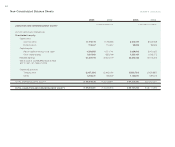
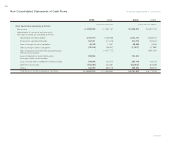
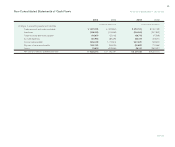
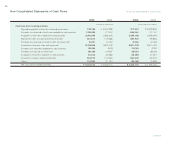
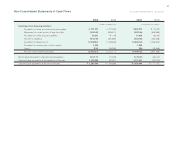
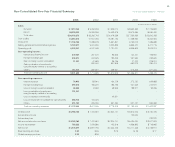
Non-Consolidated Statements of Cash Flows
₩701,331 ₩210,062 $ 585,907 $ 175,490
(183,340)(835,611)(153,166)(698,088)
23,531 187,145 19,658 156,345
(910,192)(337,899)(760,394)(282,288)
(1,978,562)(1,499,843)(1,652,934)(1,253,002)
1,909 -1,595 -
(104)(35,965)(86)(30,046)
(2,345,427)(2,312,111)(1,959,420)(1,931,589)
(141,171)419,009 (117,937)350,049
1,409,380 990,371 1,177,427 827,378
₩1,268,209 ₩1,409,380 $ 1,059,490 $ 1,177,427
Cash flows from financing activities:
Proceeds from other accounts and notes payable
Repayment of current portion of long-term debt
Proceeds from other long term liabilities
Payment of dividends
Acquisition of treasury stock
Proceeds from the exercise of stock options
Others
Net cash used in financing activities
Net increase (decrease) in cash and cash equivalents
Cash and cash equivalents at the beginning of the year
Cash and cash equivalents at the end of the year
In millions of Korean won In thousands of U.S.dollars
2003 2002 2003 2002
For the years ended December 31, 2003 and 2002