Samsung 2003 Annual Report Download - page 58
Download and view the complete annual report
Please find page 58 of the 2003 Samsung annual report below. You can navigate through the pages in the report by either clicking on the pages listed below, or by using the keyword search tool below to find specific information within the annual report.-
 1
1 -
2
-
3
-
4
-
5
-
6
-
7
-
8
-
9
-
10
-
11
-
12
-
13
-
14
-
15
-
16
-
17
-
18
-
19
-
20
-
21
-
22
-
23
-
24
-
25
-
26
-
27
-
28
-
29
-
30
-
31
-
32
-
33
-
34
-
35
-
36
-
37
-
38
-
39
-
40
-
41
-
42
-
43
-
44
-
45
-
46
-
47
-
 48
48 -
 49
49 -
 50
50 -
 51
51 -
 52
52 -
 53
53 -
 54
54 -
 55
55 -
 56
56 -
 57
57 -
 58
58 -
 59
59 -
 60
60 -
 61
61 -
 62
62 -
 63
63 -
 64
64 -
 65
65 -
 66
66 -
 67
67 -
 68
68 -
69
-
70
-
71
-
72
 |
 |
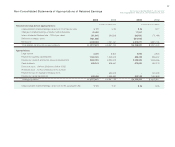
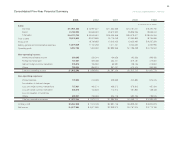
58
Continued;
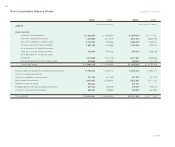
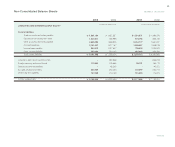
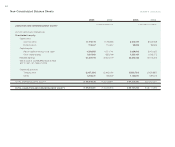
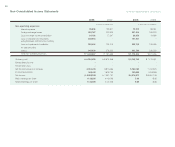
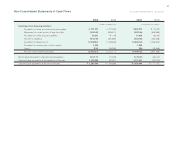
Non-Consolidated Statements of Cash Flows
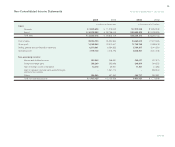
₩5,958,998 ₩7,051,761 $ 4,978,277 $ 5,891,195
3,761,119 3,155,663 3,142,121 2,636,310
257,011 277,515 214,713 231,842
34,182 17,547 28,556 14,659
(13,415)(56,957)(11,207)(47,583)
-(1,067,772)-(892,040)
228,916 -191,241 -
339,646 120,210 283,748 100,426
(414,092)424,537 (345,942)354,668
342,780 586,078 286,366 489,622
₩10,495,145 ₩10,508,582 $ 8,767,873 $ 8,779,099
Cash flows from operating activities:
Net income
Adjustments to reconcile net income to
net cash provided by operating activities:
Depreciation and amortization
Provision for severance benefits
Loss on foreign currency translation
Gain on foreign currency translation
Gain on valuation of investments using the equity
method of accounting
Loss on valuation on investments using
the equity method of accounting
Loss on impairment of available-for-sale securities
Deferred income taxes
Others
Total items not involving operating cash flows
In millions of Korean won In thousands of U.S.dollars
2003 2002 2003 2002
For the years ended December 31, 2003 and 2002