Redbox 2004 Annual Report Download - page 57
Download and view the complete annual report
Please find page 57 of the 2004 Redbox annual report below. You can navigate through the pages in the report by either clicking on the pages listed below, or by using the keyword search tool below to find specific information within the annual report.-
 1
1 -
2
-
3
-
4
-
5
-
6
-
7
-
8
-
9
-
10
-
11
-
12
-
13
-
14
-
15
-
16
-
17
-
18
-
19
-
20
-
21
-
22
-
23
-
24
-
25
-
26
-
27
-
28
-
29
-
30
-
31
-
32
-
33
-
34
-
35
-
36
-
37
-
38
-
39
-
40
-
41
-
42
-
43
-
44
-
45
-
46
-
 47
47 -
 48
48 -
 49
49 -
 50
50 -
 51
51 -
 52
52 -
 53
53 -
 54
54 -
 55
55 -
 56
56 -
 57
57 -
 58
58 -
 59
59 -
 60
60 -
 61
61 -
 62
62 -
 63
63 -
 64
64
 |
 |

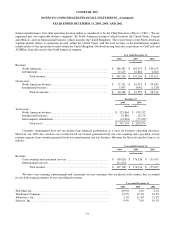
COINSTAR, INC.
NOTES TO CONSOLIDATED FINANCIAL STATEMENTS –(Continued)
YEARS ENDED DECEMBER 31, 2004, 2003, AND 2002
53
financial performance. Our chief operating decision maker is considered to be the Chief Executive Officer (“CEO”). We are
organized into two reportable business segments: the North American business (which includes the United States, Canada
and Mexico), and our International business (which includes the United Kingdom). The total revenue of the North American
segment mainly relates to operations located within the United States, and the total revenue of the International segment
mainly relates to the operations located within the United Kingdom. Goodwill arising from the acquisitions of CellCards and
ACMI has been allocated to the North American segment.
Year ended December 31,
2004
2003
2002
(in thousands)
Revenue:
North American.............................................................................................
$ 289,485
$ 165,274
$ 149,615
International ..................................................................................................
17,615
10,862
6,060
Total revenue .......................................................................................
$ 307,100
$ 176,136
$ 155,675
Net income:
North American business ..............................................................................
$ 17,311
$ 16,513
$ 59,642
International business....................................................................................
3,057
3,042
(1,129)
Total net income..................................................................................
$ 20,368
$ 19,555
$ 58,513
December 31,
2004
2003
(in thousands)
Total assets:
North American business .....................................................................................
$ 535,864
$ 199,132
International business...........................................................................................
25,886
20,174
Intercompany eliminations...................................................................................
(14,616) (15,232)
Total assets .................................................................................................
$ 547,134
$ 204,074
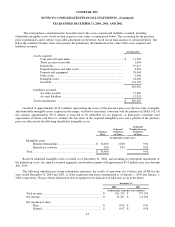
Currently, management does not use product line financial performance as a basis for business operating decisions.
However, our CEO does analyze our revenue based on revenue generated from our coin-counting and e-payment service
revenue separate from revenue generated from our entertainment services business. Revenue for these two product lines is as
follows:
Year ended December 31,
2004
2003
2002
(in thousands)
Revenue:
Coin-counting and e-payment services .........................................................
$ 196,026
$ 176,136
$ 155,675
Entertainment services ..................................................................................
111,074
—
—
Total revenue .......................................................................................
$ 307,100
$ 176,136
$ 155,675
We have coin-counting, entertainment and e-payment services machines that are placed with retailers that accounted
for the following percentages of our consolidated revenue:
Year ended December 31,
2004
2003
2002
Wal-Mart, Inc. ..........................................................................................................
20.9%
3.4%
2.1%
The Kroger Company ...............................................................................................
14.7%
22.3%
23.0%
Albertson’s, Inc.........................................................................................................
9.1%
11.8%
12.2%
Safeway, Inc. ............................................................................................................
0.4%
7.8%
10.1%