Redbox 2004 Annual Report Download - page 18
Download and view the complete annual report
Please find page 18 of the 2004 Redbox annual report below. You can navigate through the pages in the report by either clicking on the pages listed below, or by using the keyword search tool below to find specific information within the annual report.-
 1
1 -
2
-
3
-
4
-
5
-
6
-
7
-
 8
8 -
 9
9 -
 10
10 -
 11
11 -
 12
12 -
 13
13 -
 14
14 -
 15
15 -
 16
16 -
 17
17 -
 18
18 -
 19
19 -
 20
20 -
 21
21 -
 22
22 -
 23
23 -
 24
24 -
 25
25 -
 26
26 -
 27
27 -
 28
28 -
29
-
30
-
31
-
32
-
33
-
34
-
35
-
36
-
37
-
38
-
39
-
40
-
41
-
42
-
43
-
44
-
45
-
46
-
47
-
48
-
49
-
50
-
51
-
52
-
53
-
54
-
55
-
56
-
57
-
58
-
59
-
60
-
61
-
62
-
63
-
64
 |
 |

14
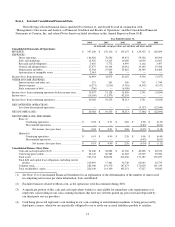
Item 6. Selected Consolidated Financial Data.
The following selected financial data is qualified by reference to, and should be read in conjunction with,
“Management’s Discussion and Analysis of Financial Condition and Results of Operations” and the Consolidated Financial
Statements of Coinstar, Inc. and related Notes thereto included elsewhere in this Annual Report on Form 10-K.
Year Ended December 31,
2004
2003
2002
2001
2000
(in thousands, except per share, per unit data and where noted)
Consolidated Statements of Operations:
REVENUE $ 307,100
$ 176,136
$ 155,675
$ 129,352
$ 102,609
EXPENSES:
Direct operating................................................................
.....
186,926
78,586
69,451
59,326
49,294
Sales and marketing................................
...............................
12,925
13,215
10,689
11,039
12,867
Research and development ................................
....................
5,465
5,772
4,997
4,162
3,497
General and administrative................................
....................
27,475
19,344
19,061
19,140
15,568
Depreciation and other................................
...........................
35,302
27,006
25,810
26,349
24,460
Amortization of intangible assets ................................
..........
2,014
138
—
—
—
Income (loss) from operations................................
..........................
36,993
32,075
25,667
9,336
(3,077)
OTHER INCOME (EXPENSE):
Interest income and other, net................................
................
521
263
309
707
1,740
Interest expense ................................................................
.....
(6,271)
(1,210)
(3,710)
(8,302)
(8,517)
Early retirement of debt................................
.........................
(706)
—
(6,308)
—
—
Income (loss) from continuing operations before income taxes
.......
30,537
31,128
15,958
1,741
(9,854)
Income taxes ................................................................
....................
(10,169)
(11,573)
42,555
—
—
Income (loss) from continuing operations................................
........
20,368
19,555
58,513
1,741
(9,854)
DISCONTINUED OPERATIONS:
Loss from discontinued operations................................
........
—
—
—
(9,127)
(12,840)
NET INCOME (LOSS) $ 20,368
$ 19,555
$ 58,513
$ (7,386)
$ (22,694)
NET INCOME (LOSS) PER SHARE:
Basic:(1)
Continuing operations................................
.................
$ 0.94
$ 0.91
$ 2.68
$ 0.08
$ (0.49)
Discontinued operations................................
..............
—
—
—
(0.43)
(0.63)
Net income (loss) per share
..............................
$ 0.94
$ 0.91
$ 2.68
$ (0.35)
$ (1.12)
Diluted:(1)
Continuing operations................................
.................
$ 0.93
$ 0.90
$ 2.58
$ 0.08
$ (0.49)
Discontinued operations................................
..............
—
—
—
(0.42)
(0.63)
Net income (loss) per share
..............................
$ 0.93
$ 0.90
$ 2.58
$ (0.34)
$ (1.12)
Consolidated Balance Sheet Data:
Cash and cash equivalents(2)(3)................................
............
$ 94,640
$ 38,882
$ 41,560
$ 40,428
$ 20,102
Cash being processed(4)................................
........................
62,147
60,782
61,283
65,507
50,582
Total assets ................................................................
............
547,134
204,074
216,636
171,187
156,037
Total debt and capital lease obligations, including current
portion................................................................
..............
210,919
17,461
36,746
62,643
62,735
Common stock................................................................
.......
282,046
191,370
187,473
171,059
161,339
Total stockholders’ equity ................................
.....................
226,146
114,190
105,251
37,227
34,842
(1) See Note 13 to Consolidated Financial Statements for an explanation of the determination of the number of shares used
in computing net income per share information, basic and diluted.
(2) Excludes balances related to Meals.com, as the operations were discontinued during 2001.
(3) A significant portion of this cash and cash equivalents balance is unavailable for immediate cash requirements as it
represents coin residing in our coin-counting machines that have not yet been picked up, processed and deposited by
our third-party service providers.
(4) Cash being processed represents coin residing in our coin-counting or entertainment machines or being processed by
third-party carriers, which we are specifically obligated to use to settle our accrued liabilities payable to retailers.