Redbox 2004 Annual Report Download - page 29
Download and view the complete annual report
Please find page 29 of the 2004 Redbox annual report below. You can navigate through the pages in the report by either clicking on the pages listed below, or by using the keyword search tool below to find specific information within the annual report.-
 1
1 -
2
-
3
-
4
-
5
-
6
-
7
-
8
-
9
-
10
-
11
-
12
-
13
-
14
-
15
-
16
-
17
-
18
-
 19
19 -
 20
20 -
 21
21 -
 22
22 -
 23
23 -
 24
24 -
 25
25 -
 26
26 -
 27
27 -
 28
28 -
 29
29 -
 30
30 -
 31
31 -
 32
32 -
 33
33 -
 34
34 -
 35
35 -
 36
36 -
 37
37 -
 38
38 -
 39
39 -
40
-
41
-
42
-
43
-
44
-
45
-
46
-
47
-
48
-
49
-
50
-
51
-
52
-
53
-
54
-
55
-
56
-
57
-
58
-
59
-
60
-
61
-
62
-
63
-
64
 |
 |

25
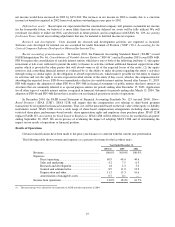
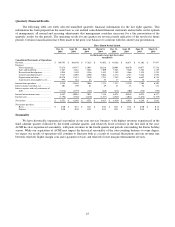
Quarterly Financial Results
The following table sets forth selected unaudited quarterly financial information for the last eight quarters. This
information has been prepared on the same basis as our audited consolidated financial statements and includes, in the opinion
of management, all normal and recurring adjustments that management considers necessary for a fair presentation of the
quarterly results for the periods. The operating results for any quarter are not necessarily indicative of the results for future
periods. Certain reclassifications have been made to the prior year balances to conform with the current year presentation.
Three Month Periods Ended
Dec. 31,
2004
Sept. 30,
2004
June 30,
2004
March 31,
2004
Dec. 31,
2003
Sept. 30,
2003
June 30,
2003
March 31,
2003
(in thousands, except per share data)
(unaudited)
Consolidated Statements of Operations:
Revenue...................................................
$ 109,793
$ 106,430
$ 47,825
$ 43,052
$ 46,366
$ 48,671
$ 43,102
$ 37,997
Expenses:
Direct operating.................................
73,678
69,937
23,093
20,218
20,904
20,870
19,077
17,736
Sales and marketing ..........................
4,567
3,642
3,666
1,050
5,262
3,440
3,384
1,129
Research and development................
1,058
1,410
1,556
1,441
1,389
1,566
1,524
1,293
General and administrative................
9,423
8,098
4,890
5,064
4,376
4,783
5,228
4,956
Depreciation and other ......................
10,116
9,821
7,450
7,915
7,245
6,764
6,642
6,355
Amortization of intangible assets ......
993
884
84
53
37
38
38
25
Income from operations...........................
9,958
12,638
7,086
7,311
7,153
11,210
7,209
6,503
Interest income and other, net..................
201
190
61
69
41
38
52
132
Interest expense and early retirement of
debt ...................................................
(3,812)
(2,793) (126
)
(246) (216) (300) (336
)
(358)
Income before income taxes ....................
6,347
10,035
7,021
7,134
6,978
10,948
6,925
6,277
Income taxes............................................
(1,796)
(3,386) (2,470
)
(2,517) (2,548) (4,014) (2,676
)
(2,335)
Net income ..............................................
$ 4,551
$ 6,649
$ 4,551
$ 4,617
$ 4,430
$ 6,934
$ 4,249
$ 3,942
Net income per share:
Basic .................................................
$ 0.20
$ 0.31
$ 0.21
$ 0.22
$ 0.21
$ 0.32
$ 0.20
$ 0.18
Diluted ..............................................
0.20
0.30
0.21
0.21
0.21
0.32
0.19
0.18
Seasonality
We have historically experienced seasonality in our coin services business, with highest revenues experienced in the
third calendar quarter, followed by the fourth calendar quarter, and relatively lower revenues in the first half of the year.
ACMI has also experienced seasonality, with peak revenues in the fourth quarter and periods surrounding the Easter holiday
season. While our acquisition of ACMI may impact the historical seasonality of the coin-counting business to some degree,
we expect our results of operations will continue to fluctuate both as a result of seasonal fluctuations and our revenue mix
between relatively higher margin coin and e-payment services and relatively lower margin entertainment services.