Qantas 2016 Annual Report Download - page 77
Download and view the complete annual report
Please find page 77 of the 2016 Qantas annual report below. You can navigate through the pages in the report by either clicking on the pages listed below, or by using the keyword search tool below to find specific information within the annual report.-
 1
1 -
2
-
3
-
4
-
5
-
6
-
7
-
8
-
9
-
10
-
11
-
12
-
13
-
14
-
15
-
16
-
17
-
18
-
19
-
20
-
21
-
22
-
23
-
24
-
25
-
26
-
27
-
28
-
29
-
30
-
31
-
32
-
33
-
34
-
35
-
36
-
37
-
38
-
39
-
40
-
41
-
42
-
43
-
44
-
45
-
46
-
47
-
48
-
49
-
50
-
51
-
52
-
53
-
54
-
55
-
56
-
57
-
58
-
59
-
60
-
61
-
62
-
63
-
64
-
65
-
66
-
 67
67 -
 68
68 -
 69
69 -
 70
70 -
 71
71 -
 72
72 -
 73
73 -
 74
74 -
 75
75 -
 76
76 -
 77
77 -
 78
78 -
 79
79 -
 80
80 -
 81
81 -
 82
82 -
 83
83 -
 84
84 -
 85
85 -
 86
86 -
 87
87 -
88
-
89
-
90
-
91
-
92
-
93
-
94
-
95
-
96
-
97
-
98
-
99
-
100
-
101
-
102
-
103
-
104
-
105
-
106
 |
 |

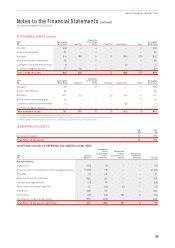
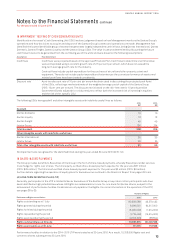
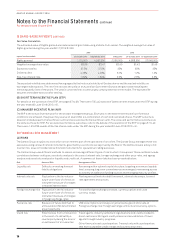
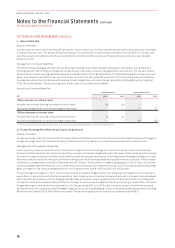
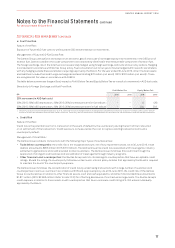
Notes to the Financial Statements continued
For the year ended 30 June 2016
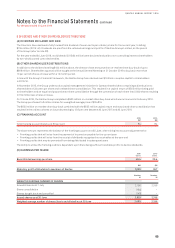
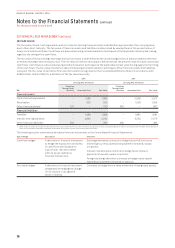
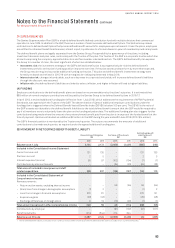
20 FINANCIAL RISK MANAGEMENT CONTINUED
i. Liquidity Risk
Nature of the Risk:
Liquidity risk is the risk that an entity will encounter difficulty in meeting obligations associated with financial liabilities.
Liquidity Risk Management:
The Qantas Group manages liquidity risk by targeting a minimum liquidity level, ensuring long-term commitments are managed with
respect to forecast available cash inflows, maintaining access to a variety of additional funding sources, including commercial paper
and standby facilities and managing maturity profiles. Qantas may from time to time seek to purchase and retire outstanding debt
through cash purchases in open market transactions, privately negotiated transactions or otherwise. Any such repurchases would
depend on prevailing market conditions, liquidity requirements and possibly other factors.
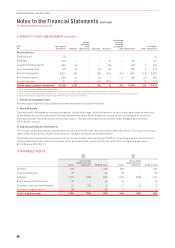
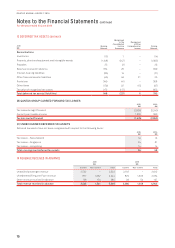
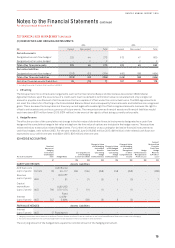
The following table summarises the contractual timing of cash flows, including estimated interest payments, of financial liabilities
and derivative instruments. The contractual amount assumes current interest rates and foreign exchange rates.
2016
$M
Less Than
1 Year 1 to 5 Years
More Than
5 Years Total
FINANCIAL LIABILITIES
Payables 1,986 – – 1,986
Bank loans – secured1367 1,444 560 2,371
Bank loans – unsecured19297 – 306
Other loans – unsecured1118 954 325 1,397
Lease and hire purchase liabilities1147 588 1,034 1,769
Derivatives – inflows (16) (46) (1) (63)
Derivatives – outflows 30 84 2116
Net other financial assets/liabilities – outflows (41) (26) –(67)
Total financial liabilities 2,600 3,295 1,920 7,815
1 Recognised financial liability maturity values are shown pre-hedging.
2015
$M
Less Than
1 Year 1 to 5 Years
More Than
5 Years Total
FINANCIAL LIABILITIES
Payables 1,881 – – 1,881
Bank loans – secured1383 1,481 885 2,749
Bank loans – unsecured111 313 –324
Other loans – unsecured1472 613 777 1,862
Lease and hire purchase liabilities1135 553 1,150 1,838
Derivatives – inflows (370) (58) (4) (432)
Derivatives – outflows 334 109 8451
Net other financial assets/liabilities – outflows (152) (22) –(174)
Total financial liabilities 2,694 2,989 2,816 8,499
1 Recognised financial liability maturity values are shown pre-hedging.
75
QANTAS ANNUAL REPORT 2016