Qantas 2016 Annual Report Download - page 22
Download and view the complete annual report
Please find page 22 of the 2016 Qantas annual report below. You can navigate through the pages in the report by either clicking on the pages listed below, or by using the keyword search tool below to find specific information within the annual report.-
 1
1 -
2
-
3
-
4
-
5
-
6
-
7
-
8
-
9
-
10
-
11
-
 12
12 -
 13
13 -
 14
14 -
 15
15 -
 16
16 -
 17
17 -
 18
18 -
 19
19 -
 20
20 -
 21
21 -
 22
22 -
 23
23 -
 24
24 -
 25
25 -
 26
26 -
 27
27 -
 28
28 -
 29
29 -
 30
30 -
 31
31 -
 32
32 -
33
-
34
-
35
-
36
-
37
-
38
-
39
-
40
-
41
-
42
-
43
-
44
-
45
-
46
-
47
-
48
-
49
-
50
-
51
-
52
-
53
-
54
-
55
-
56
-
57
-
58
-
59
-
60
-
61
-
62
-
63
-
64
-
65
-
66
-
67
-
68
-
69
-
70
-
71
-
72
-
73
-
74
-
75
-
76
-
77
-
78
-
79
-
80
-
81
-
82
-
83
-
84
-
85
-
86
-
87
-
88
-
89
-
90
-
91
-
92
-
93
-
94
-
95
-
96
-
97
-
98
-
99
-
100
-
101
-
102
-
103
-
104
-
105
-
106
 |
 |
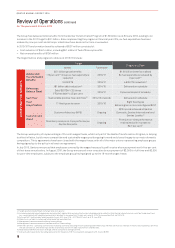
Review of Operations continued
For the year ended 30 June 2016
Qantas International achieved a record Underlying EBIT of $512 million, a $1 billion turnaround since 2013/14 that reflects the
successful restructure of the segment’s cost base, network and alliance partners, and a more dynamic approach to scheduling that
has created new revenue opportunities. Highlights of the 2015/16 result included:
–Revenue increased five per cent with capacity growth and seat factor improvement
–Unit Revenue decline of one per cent for 2015/16 with a second-half 2015/16 decline of five per cent amid competitive market pricing
–Ex-fuel unit45 cost improvement of four per cent driving margin uplift
–Qantas Transformation delivering utilisation increase of five per cent46
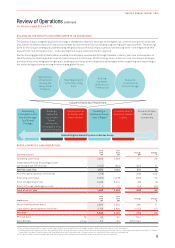
Aircraft were reallocated from Qantas Domestic to Qantas International in response to shifting demand, facilitating additional
services to higher growth markets in Asia. Over the course of the financial year Qantas International added services to Japan, China,
Singapore and Bali, consistent with its strategic objective of aligning with the region’s passenger growth.
Qantas International continued to broaden its network and strengthen offshore distribution with new alliance partnerships
announced with American Airlines and China Eastern47. The early integration of each alliance tracked according to plan, with
synergies to begin being realised in 2016/17.
Record customer advocacy48 results at the segment were the result of continued investment in product and service with all
10International A330–300 cabin reconfigurations completed.
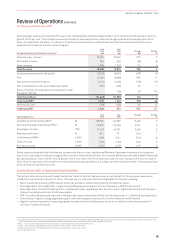
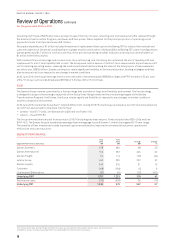
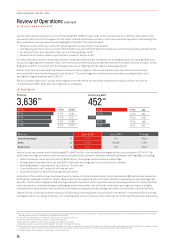
JETSTAR GROUP
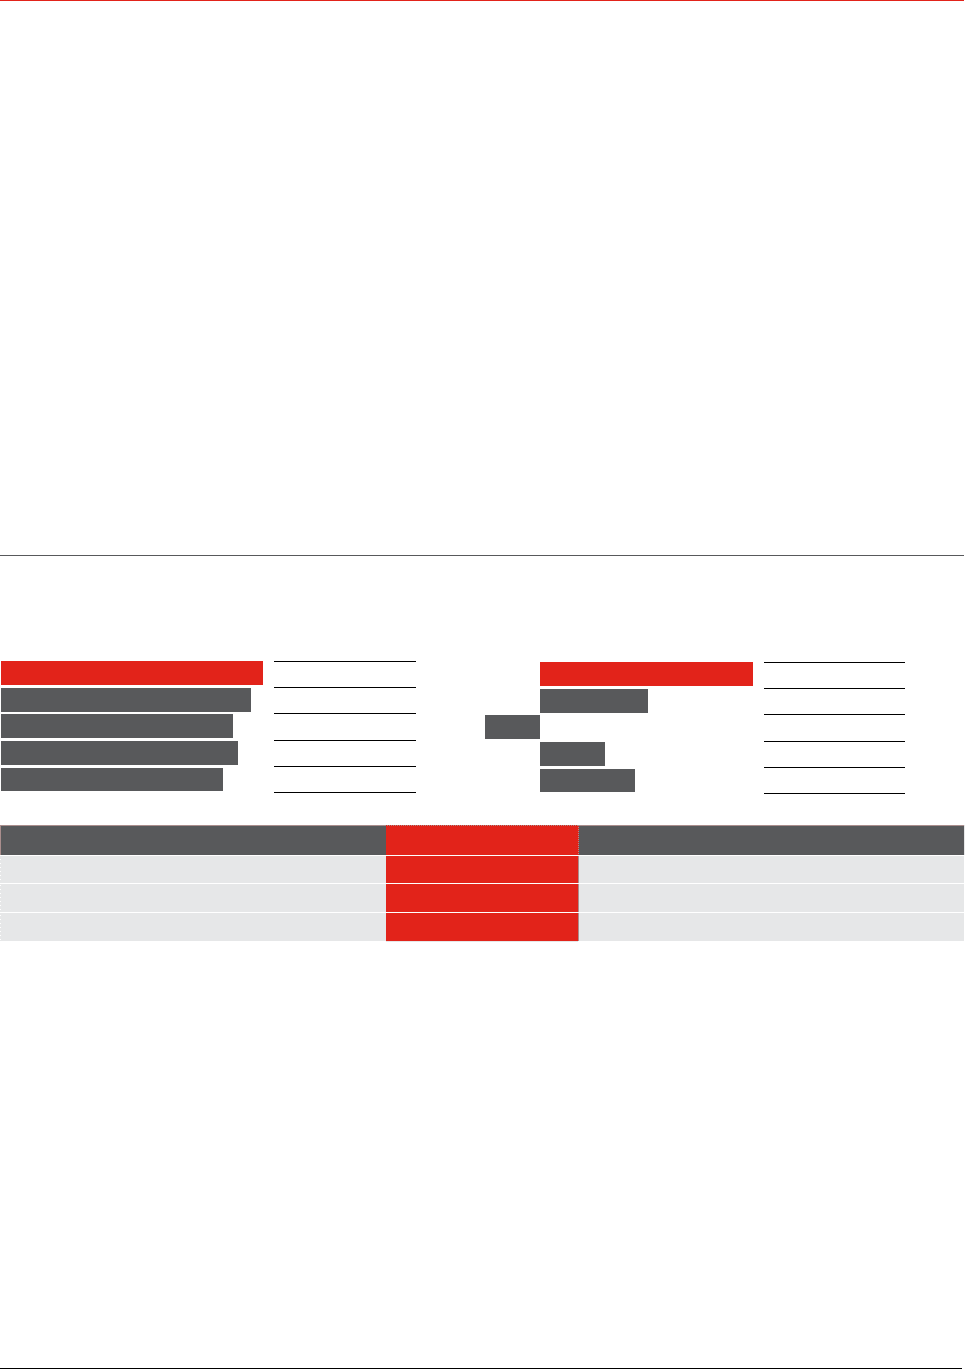
Metrics June 2016 June 2015 Change
Operating margin %12.4 6.6 5.8pts
ASKs M48,832 46,386 5.3%
Seat factor %81.5 79.9 1.6pts
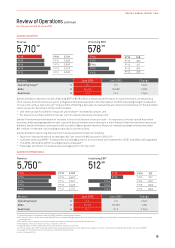
Jetstar Group reported a record Underlying EBIT of $452 million, almost double the segment’s prior record result in 2014/15. The
result saw a strong contribution from across the Jetstar Group’s domestic and international businesses, with highlights including:
–Jetstar Domestic result up 62 per cent to $242 million, leveraging brand and network advantage
–Strong Jetstar International profit with B787–8 efficiencies and growth in core Asia-Pacific markets
–Operating margin49 improvement, up 5.8 pts to 12.4 per cent
–Controllable unit cost50 reduction of three per cent
–Successful launch of New Zealand regional operations
A stand out of the Jetstar Group result was the performance of Jetstar Airlines in Asia
51
which delivered an $85 million improvement in
profitability compared to 2014/15. Jetstar Japan reported its maiden full year profit with international expansions and realising scale
benefits. Jetstar Asia in Singapore had a strong result with the launch of four new destinations (including charters into China) and total
unit cost reduction, notwithstanding a challenging competitive market. Jetstar Pacific in Vietnam’s earnings were lower in a highly
competitive low fares market in the country, but continues to represent an attractive growth option for the Group in South East Asia.
Jetstar’s focus on driving customer advocacy and ancillary revenue growth continued with investment in innovative service training
and digital sales. A re-design of jetstar.com, including data-driven ancillary product offering, has enhanced the customer experience.
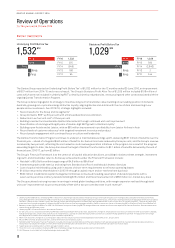
FY16
FY15
FY14
FY13
FY12
Revenue
3,636
$M
FY16 3,636
FY15 3,464
FY14 3,222
FY13 3,288
F Y12 3,076
FY16
FY15
FY14
FY13
FY12
Underlying EBIT
452
$M
FY16 452
FY15 230
FY14 (116)
FY13 138
F Y12 203
45 Ex-fuel unit cost is calculated as Underlying PBT less ticketed passenger revenue and fuel, adjusted for changes in: employee provision discount rates and other assumptions, foreign
exchange rates, and block codeshare flying agreements per ASK.
46 Calculated as average block hours per aircraft per day. Compared to 2014/15.
47 American Airlines partnership is subject to regulatory approval.
48 Average 2015/16 Net Promoter Score, based on internal Qantas reporting.
49 Operating margin calculated as Underlying EBIT divided by total segment revenue.
50 Controllable unit cost excludes Jetstar New Zealand Regionals which commenced in December 2015, and is calculated as Underlying expenses less fuel, adjusted for changes in foreign
exchange rates, share of net profit/(loss) of investments accounted for under the equity method, charter revenue and changes in sector length per ASK.
51 Includes Jetstar Asia (Singapore), Jetstar Japan and Jetstar Pacific.
20
QANTAS ANNUAL REPORT 2016