Qantas 2016 Annual Report Download - page 47
Download and view the complete annual report
Please find page 47 of the 2016 Qantas annual report below. You can navigate through the pages in the report by either clicking on the pages listed below, or by using the keyword search tool below to find specific information within the annual report.-
 1
1 -
2
-
3
-
4
-
5
-
6
-
7
-
8
-
9
-
10
-
11
-
12
-
13
-
14
-
15
-
16
-
17
-
18
-
19
-
20
-
21
-
22
-
23
-
24
-
25
-
26
-
27
-
28
-
29
-
30
-
31
-
32
-
33
-
34
-
35
-
36
-
 37
37 -
 38
38 -
 39
39 -
 40
40 -
 41
41 -
 42
42 -
 43
43 -
 44
44 -
 45
45 -
 46
46 -
 47
47 -
 48
48 -
 49
49 -
 50
50 -
 51
51 -
 52
52 -
 53
53 -
 54
54 -
 55
55 -
 56
56 -
 57
57 -
58
-
59
-
60
-
61
-
62
-
63
-
64
-
65
-
66
-
67
-
68
-
69
-
70
-
71
-
72
-
73
-
74
-
75
-
76
-
77
-
78
-
79
-
80
-
81
-
82
-
83
-
84
-
85
-
86
-
87
-
88
-
89
-
90
-
91
-
92
-
93
-
94
-
95
-
96
-
97
-
98
-
99
-
100
-
101
-
102
-
103
-
104
-
105
-
106
 |
 |
Directors’ Report continued
For the year ended 30 June 2016
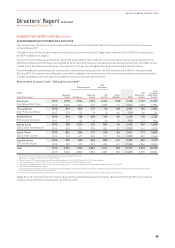
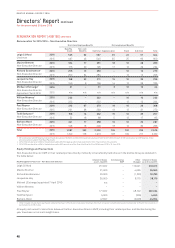
REMUNERATION REPORT (AUDITED) CONTINUED
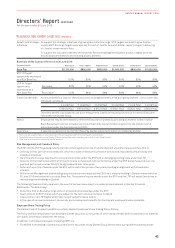
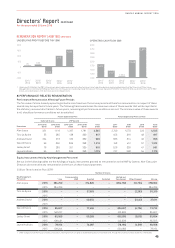
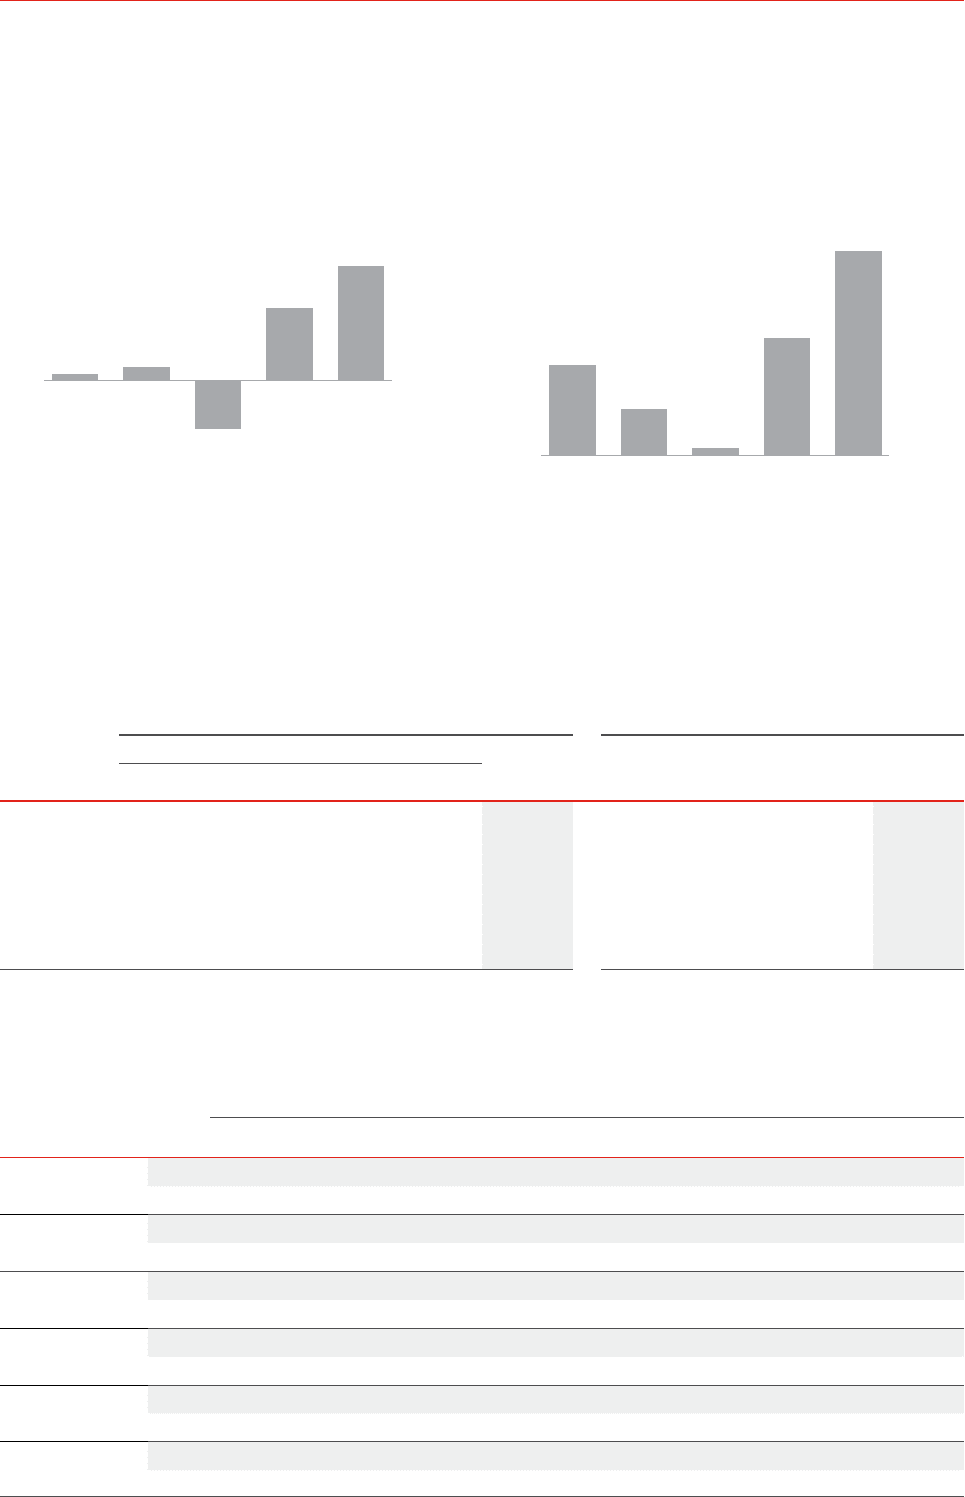
UNDERLYING PROFIT BEFORE TAX1 ($M)
-
1000
-500
0
500
1000
1500
2000
2011/
2012 2012/
2013 2013/
2014 2014/
2015
2015/
2016
95 186
(646)
975
1,532
OPERATING CASH FLOW ($M)
1
,000
1
,250
1,500
1
,750
2
,000
2
,250
2
,500
2
,750
3
,000
2011/
2012
2012/
2013
2013/
2014
2014/
2015
2015/
2016
1,810
1,417 1,069
2,048
2,819
1 Underlying Profit Before Tax (PBT) is the primary reporting measure used by the Qantas Group’s chief operating decision-making bodies, being the Chief Executive Officer, Group
Management Committee and the Board of Directors, for the purpose of assessing the performance of the Group. Statutory Profit After Tax for 2015/2016 was $1,029 million (2015: $560
million, 2014: ($2.8) billion, 2013: $2 million and 2012: ($244) million).
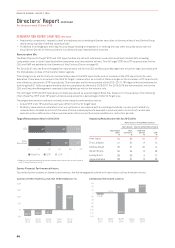
8) PERFORMANCE-RELATED REMUNERATION
Performance Remuneration Affecting Future Periods
The fair value of share-based payments granted is amortised over the service period and therefore remuneration in respect of these
awards may be reported in future years. The following table summarises the maximum value of these awards that will be reported in
the statutory remuneration tables in future years, assuming all performance conditions are met. The minimum value of these awards
is nil, should performance conditions not be satisfied.
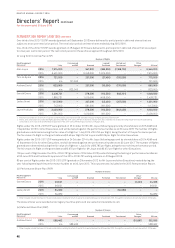
Future Expense by Plan Future Expense by Financial Year
Deferred Shares LTIP Awards
Executives
2014/2015
$’000
2015/2016
$’000
2015–2017
$’000
2016–2018
$’000
Total
$’000
2017
$’000
2018
$’000
2019
$’000
Total
$’000
Alan Joyce 351 1,116 1,297 1,781 4,545 2,749 1,573 223 4,545
Tino La Spina 55 285 138 339 817 453 316 48 817
Andrew David 224 273 160 339 996 636 314 46 996
Gareth Evans 99 350 365 398 1,212 74 3 412 57 1,212
Lesley Grant 76 285 201 339 901 526 328 47 901
Jayne Hrdlicka 95 321 365 398 1,179 727 398 54 1,179
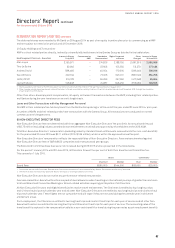
Equity Instruments Held by Key Management Personnel
Set out in the following tables are the holdings of equity instruments granted as remuneration to the KMP by Qantas. Non-Executive
Directors do not receive any remuneration in the form of share-based payments.
(i) Short Term Incentive Plan (STIP)
Number of Shares
Key Management
Personnel 1 July
Commenced as
KMP Granted Forfeited
Vested and
Transferred Other Changes130 June
Alan Joyce 2016 284,769 –274,826 –(284,769) (16,764) 258,062
2015 284,769 – – – – – 284,769
Tino La Spina 2016 – – 37,6 0 3 – – (2,293) 35,310
2015 –––––––
Andrew David 2016 – – 40,054 – – (2,443) 37,611
2015 –––––––
Gareth Evans 2016 85,607 –7 7,4 5 6 –(85,607) (4,724) 72,732
2015 148,227 – – – (62,620) –85,607
Lesley Grant 2016 65,505 –59,269 –(65,505) (3,615) 55,654
2015 108,431 – – – (42,926) –65,505
Jayne Hrdlicka 2016 78,16 4 –74,087 –(78,164) (4,519) 69,568
2015 128,244 – – – (50,080) –78,164
1 Other changes include the impact of share consolidation, relating to return of capital to shareholders paid on 6 November 2015, through the conversion of each share into 0.939 shares.
45
QANTAS ANNUAL REPORT 2016