Qantas 2016 Annual Report Download - page 24
Download and view the complete annual report
Please find page 24 of the 2016 Qantas annual report below. You can navigate through the pages in the report by either clicking on the pages listed below, or by using the keyword search tool below to find specific information within the annual report.-
 1
1 -
2
-
3
-
4
-
5
-
6
-
7
-
8
-
9
-
10
-
11
-
12
-
13
-
 14
14 -
 15
15 -
 16
16 -
 17
17 -
 18
18 -
 19
19 -
 20
20 -
 21
21 -
 22
22 -
 23
23 -
 24
24 -
 25
25 -
 26
26 -
 27
27 -
 28
28 -
 29
29 -
 30
30 -
 31
31 -
 32
32 -
 33
33 -
 34
34 -
35
-
36
-
37
-
38
-
39
-
40
-
41
-
42
-
43
-
44
-
45
-
46
-
47
-
48
-
49
-
50
-
51
-
52
-
53
-
54
-
55
-
56
-
57
-
58
-
59
-
60
-
61
-
62
-
63
-
64
-
65
-
66
-
67
-
68
-
69
-
70
-
71
-
72
-
73
-
74
-
75
-
76
-
77
-
78
-
79
-
80
-
81
-
82
-
83
-
84
-
85
-
86
-
87
-
88
-
89
-
90
-
91
-
92
-
93
-
94
-
95
-
96
-
97
-
98
-
99
-
100
-
101
-
102
-
103
-
104
-
105
-
106
 |
 |

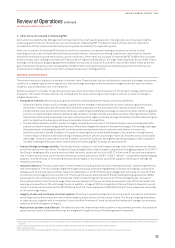
Review of Operations continued
For the year ended 30 June 2016
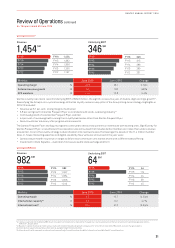
Qantas Freight reported an Underlying EBIT of $64 million, a $50 million decrease from the prior year in line with guidance provided
at the Group’s full year 2014/15 results. The performance reflected challenging global cargo markets, and more in keeping with
historical performance. Key drivers of the result included:
–Revenue performance reflecting flat demand against a six per cent global capacity increase
–Conclusion of favourable Australian air Express legacy agreements in 2014/15
–Continued cost reduction through Qantas Transformation
Qantas Freight retains a leading position in the Australian cargo market with Australia Post and Toll Group, Australia’s largest air
freight customers, under contract. With yields likely remaining under pressure, the segment is focused on delivering on strategic
objectives to ensure sustainable performance in the future:
–Integrated ground to air operations
–Continued cost reduction through Qantas Transformation
–Developing growth opportunities into China through tactical freight deployment to Zhengzhou and Chongqing
–Agile scheduling to adapt to changing markets – for example new freighter stop-off into Dallas
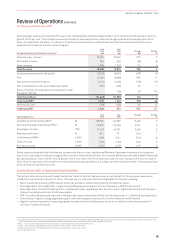
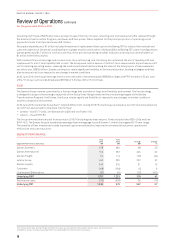
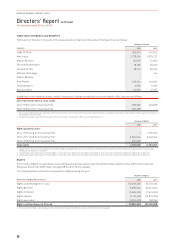
RECONCILIATION OF UNDERLYING PBT TO STATUTORY PROFIT BEFORE TAX
The Statutory Profit Before Tax of $1,424 million for the year ended 30 June 2016 is $635 million higher than the prior year.
Underlying PBT
Underlying PBT is the primary reporting measure used by the Qantas Group’s chief operating decision-making bodies, being the
Chief Executive Officer, Group Management Committee and the Board of Directors, for the purpose of assessing the performance
of the Group. The primary reporting measure of the Qantas International, Qantas Domestic, Jetstar Group, Qantas Loyalty and
Qantas Freight operating segments is Underlying EBIT. The primary reporting measure of the Corporate segment is Underlying PBT
as net finance costs are managed centrally. Underlying PBT is derived by adjusting Statutory Profit Before Tax for the impacts of
ineffectiveness and non-designated derivatives relating to other reporting periods and certain other items which are not included
inUnderlying PBT.
2016
$M
2015
$M
Statutory
Ineffectiveness
relating to
other reporting
periods
Other items
not included
in Underlying
PBT Underlying Statutory
Ineffectiveness
relating to
other reporting
periods
Other items
not included
in Underlying
PBT Underlying
Net passenger revenue 13,961 – – 13,961 13,604 – – 13,604
Net freight revenue 850 – – 850 936 – – 936
Other 1,389 – – 1,389 1,276 – – 1,276
Revenue and other income 16,200 – – 16,200 15,816 – – 15,816
Manpower and staff related 3,849 –(22) 3,827 3,604 –(13) 3,591
Fuel 3,250 (15) –3,235 3,937 (38) –3,899
Aircraft operating variable 3,362 –(5) 3,357 3,206 –(3) 3,203
Depreciation and
amortisation 1,224 – – 1,224 1,096 – – 1,096
Non-cancellable aircraft
operating lease rentals 461 – – 461 495 – – 495
Share of net (profit)/loss of
investments accounted for
under the equity method
–––– 40 –(11) 29
Other 2,411 –(66) 2,345 2,390 –(120) 2,270
Expenses 14,557 (15) (93) 14,449 14,768 (38) (147) 14,583
Earnings Before Interest
and Tax 1,643 15 93 1,751 1,048 38 147 1,233
Net finance costs (219) – – (219) (259) 1 – (258)
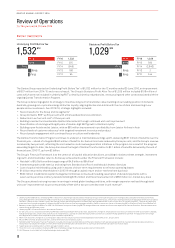
PBT 1,424 15 93 1,532 789 39 147 975
Underlying PBT is derived by adjusting Statutory Profit Before Tax for the impacts of:
i. Ineffectiveness and non-designated derivatives relating to other reporting periods
The difference between Statutory Profit Before Tax and Underlying PBT results from derivative mark-to-market movements being
recognised in the Consolidated Income Statement in a different period to the underlying exposure.
22
QANTAS ANNUAL REPORT 2016