Qantas 2016 Annual Report Download - page 64
Download and view the complete annual report
Please find page 64 of the 2016 Qantas annual report below. You can navigate through the pages in the report by either clicking on the pages listed below, or by using the keyword search tool below to find specific information within the annual report.-
 1
1 -
2
-
3
-
4
-
5
-
6
-
7
-
8
-
9
-
10
-
11
-
12
-
13
-
14
-
15
-
16
-
17
-
18
-
19
-
20
-
21
-
22
-
23
-
24
-
25
-
26
-
27
-
28
-
29
-
30
-
31
-
32
-
33
-
34
-
35
-
36
-
37
-
38
-
39
-
40
-
41
-
42
-
43
-
44
-
45
-
46
-
47
-
48
-
49
-
50
-
51
-
52
-
53
-
 54
54 -
 55
55 -
 56
56 -
 57
57 -
 58
58 -
 59
59 -
 60
60 -
 61
61 -
 62
62 -
 63
63 -
 64
64 -
 65
65 -
 66
66 -
 67
67 -
 68
68 -
 69
69 -
 70
70 -
 71
71 -
 72
72 -
 73
73 -
 74
74 -
75
-
76
-
77
-
78
-
79
-
80
-
81
-
82
-
83
-
84
-
85
-
86
-
87
-
88
-
89
-
90
-
91
-
92
-
93
-
94
-
95
-
96
-
97
-
98
-
99
-
100
-
101
-
102
-
103
-
104
-
105
-
106
 |
 |

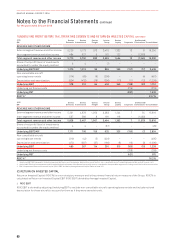
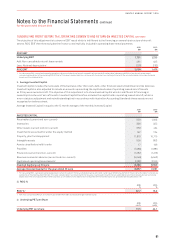
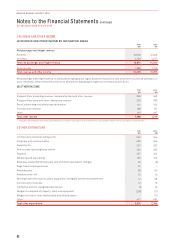
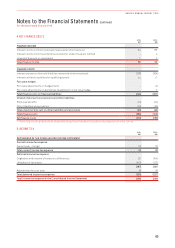
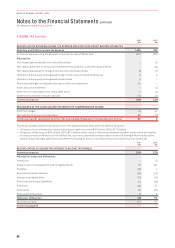
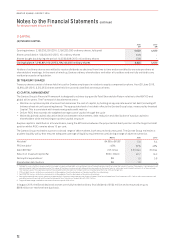
Notes to the Financial Statements continued
For the year ended 30 June 2016
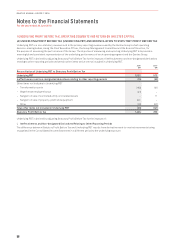
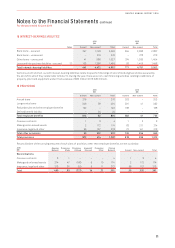
2 REVENUE AND OTHER INCOME
(A) REVENUE AND OTHER INCOME BY GEOGRAPHIC AREAS
2016
$M
2015
$M
Net passenger and freight revenue
Australia 10,563 10,523
Overseas 4,248 4,017
Total net passenger and freight revenue 14,811 14,540
Other income 1,389 1,276
Total revenue and other income 16,200 15,816
Net passenger and freight revenue is attributed to a geographic region based on the point of sale and where not directly available, on
a pro-rata basis. Other revenue/income is not allocated to a geographic region as it is impractical to do so.
(B) OTHER INCOME
2016
$M
2015
$M
Frequent Flyer marketing revenue, membership fees and other revenue 395 348
Frequent Flyer store and other redemption revenue1299 286
Retail, advertising and other property revenue 141 154
Contract work revenue 138 141
Other 416 347
Total other income 1,389 1,276
1 Frequent Flyer redemption revenue excludes redemptions on Qantas Group flights which are reported as net passenger revenue in the Consolidated Income Statement.
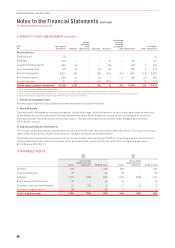
3 OTHER EXPENDITURE
2016
$M
2015
$M
Commissions and other selling costs 557 544
Computer and communication 432 400
Capacity hire 297 292
Non-aircraft operating lease rentals 234 235
Property 237 244
Marketing and advertising 132 103
Employee related benefit discount rate and other assumption changes 92 (8)
Wage freeze employee bonus 91 –
Redundancies 56 60
Inventory write-off 15 10
Net impairment of property, plant, equipment, intangible assets and investments 12 28
Contract work materials 12 16
Ineffective and non-designated derivatives (1) 13
Net gain on disposal of property, plant and equipment (226) (17)
Net gain on sale of controlled entities and related assets –(11)
Other 471 481
Total other expenditure 2,411 2,390
62
QANTAS ANNUAL REPORT 2016