Qantas 2016 Annual Report Download - page 5
Download and view the complete annual report
Please find page 5 of the 2016 Qantas annual report below. You can navigate through the pages in the report by either clicking on the pages listed below, or by using the keyword search tool below to find specific information within the annual report.-
 1
1 -
 2
2 -
 3
3 -
 4
4 -
 5
5 -
 6
6 -
 7
7 -
 8
8 -
 9
9 -
 10
10 -
 11
11 -
 12
12 -
 13
13 -
 14
14 -
 15
15 -
 16
16 -
17
-
18
-
19
-
20
-
21
-
22
-
23
-
24
-
25
-
26
-
27
-
28
-
29
-
30
-
31
-
32
-
33
-
34
-
35
-
36
-
37
-
38
-
39
-
40
-
41
-
42
-
43
-
44
-
45
-
46
-
47
-
48
-
49
-
50
-
51
-
52
-
53
-
54
-
55
-
56
-
57
-
58
-
59
-
60
-
61
-
62
-
63
-
64
-
65
-
66
-
67
-
68
-
69
-
70
-
71
-
72
-
73
-
74
-
75
-
76
-
77
-
78
-
79
-
80
-
81
-
82
-
83
-
84
-
85
-
86
-
87
-
88
-
89
-
90
-
91
-
92
-
93
-
94
-
95
-
96
-
97
-
98
-
99
-
100
-
101
-
102
-
103
-
104
-
105
-
106
 |
 |

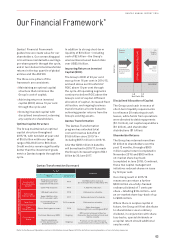
Our Financial Framework*
Qantas’ Financial Framework
guides how we create value for our
shareholders. Our overarching goal
is to achieve maintainable earnings-
per-share growth through the cycle,
and in turn deliver total shareholder
returns in the top quartile of global
airlines and the ASX100.
The three core pillars of the
framework are consistent:
> Maintaining an optimal capital
structure that minimises the
Group’s cost of capital;
> Achieving return on invested
capital (ROIC) above 10 per cent
through the cycle; and
> Growing invested capital with
disciplined investment; returning
any surplus to shareholders.
Optimal Capital Structure
The Group maintained an optimal
capital structure throughout
2015/16, with net debt at year-end
of $5.6 billion within our target
range of $4.8 billion to $6 billion.
Credit metrics remain significantly
better than the investment-grade
metrics Qantas targets through the
cycle.
In addition to strong short-term
liquidity of $3 billion – including
cash of $2 billion – the Group’s
unencumbered asset base totals
over US$3.9 billion.
Improving Return on Invested
Capital (ROIC)
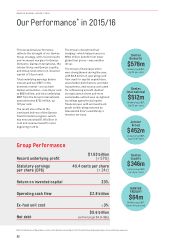
The Group’s ROIC of 23 per cent
was up from 16 per cent in 2014/15,
and well above our threshold of
ROIC above 10 per cent through
the cycle. All operating segments
continue to deliver ROIC above the
Group’s cost of capital. Efficient
allocation of capital, increased fleet
utilisation, and ongoing business
transformation all contributed to
achieving greater returns from the
Group’s existing assets.
Qantas Transformation
The Qantas Transformation
program has unlocked total
cost and revenue benefits of
$1.66 billion since 2013/14 –
including $557 million in 2015/16.
A further $450 million in benefits
will be realised in 2016/17, to reach
the Group’s increased target of $2.1
billion by 30 June 2017.
Disciplined Allocation of Capital
The Group used cash in excess of
short-term liquidity requirements
to refinance 29 maturing aircraft
leases, while funds from operations
were directed to debt repayments
($1.1 billion), net capital expenditure
($1 billion), and shareholder
distributions ($1 billion).
Shareholder Returns
The Group has returned more than
$1 billion to shareholders over the
past 12 months, through a $505
million capital return (completed in
November 2015) and $500 million
on-market share buy-back
(completed in June 2016). Combined,
these two capital management
initiatives reduced shares on issue
by 12.6 per cent.
Our strong result in 2015/16
means we can return a further
$500 million via a fully-franked
ordinary dividend of 7 cents per
share – totalling $134 million – and
an on-market share buy-back of up
to $366 million.
Where there is surplus capital in
future, the Group will first distribute
to shareholders via an ordinary
dividend, in conjunction with share
buy-backs, special dividends or
a capital return should additional
surplus exist.
Target
Progress
Metric Timeframe
Accelerated
Transformation
benefits
$2.1b gross benefits
>10% Group ex-fuel
expenditure reduction
FY17 $1.66b benefits realised.
Ex-fuel expenditure reduced by 9%
5,000 FTE reduction FY17 4,605 FTE reduction
Deleverage
Balance Sheet
>$1b debt reduction FY15 Delivered on schedule
Debt / EBITDA <3.5x
FFO / net debt > 45% FY17 Delivered ahead of schedule
Cash Flow Sustainable positive
free cash flow FY15 onwards Delivered on schedule
Fleet
Simplification Eleven fleet types to seven FY16 Eight fleet types
Retaining 2 x non-reconfigured B747
Customer and
Brand
Customer Advocacy (NPS) Ongoing
NPS record achieved at Qantas
Domestic, Qantas International and
Qantas Loyalty
Maintain premium
on-time performance:
Qantas Domestic
Ongoing Premium on-time performance
maintained with increase to 89.7%
Qantas Transformation Scorecard
ACHIEVING OUR TARGETS
*Refer to the Review of Operations section in the Qantas Annual Report 2016 for definitions and explanations of non-statutory measures
OPTIMAL CAPITAL STRUCTURE
Surplus
Capital
No
Surplus
Capital
Increased
distributions,
grow invested
capital
Debt
reduction
focus
4.8 6.0
10% ROIC
ROIC (%)
Net Debt ($b)
03
QANTAS ANNUAL REPORT 2016