Qantas 2016 Annual Report Download - page 70
Download and view the complete annual report
Please find page 70 of the 2016 Qantas annual report below. You can navigate through the pages in the report by either clicking on the pages listed below, or by using the keyword search tool below to find specific information within the annual report.-
 1
1 -
2
-
3
-
4
-
5
-
6
-
7
-
8
-
9
-
10
-
11
-
12
-
13
-
14
-
15
-
16
-
17
-
18
-
19
-
20
-
21
-
22
-
23
-
24
-
25
-
26
-
27
-
28
-
29
-
30
-
31
-
32
-
33
-
34
-
35
-
36
-
37
-
38
-
39
-
40
-
41
-
42
-
43
-
44
-
45
-
46
-
47
-
48
-
49
-
50
-
51
-
52
-
53
-
54
-
55
-
56
-
57
-
58
-
59
-
 60
60 -
 61
61 -
 62
62 -
 63
63 -
 64
64 -
 65
65 -
 66
66 -
 67
67 -
 68
68 -
 69
69 -
 70
70 -
 71
71 -
 72
72 -
 73
73 -
 74
74 -
 75
75 -
 76
76 -
 77
77 -
 78
78 -
 79
79 -
 80
80 -
81
-
82
-
83
-
84
-
85
-
86
-
87
-
88
-
89
-
90
-
91
-
92
-
93
-
94
-
95
-
96
-
97
-
98
-
99
-
100
-
101
-
102
-
103
-
104
-
105
-
106
 |
 |

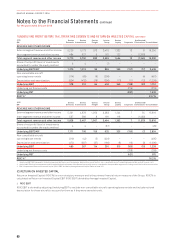
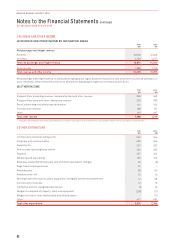
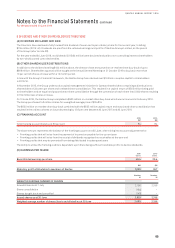
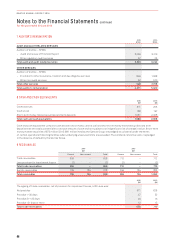
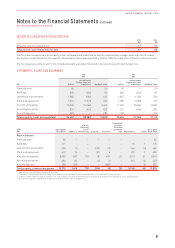
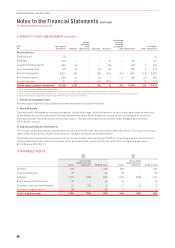
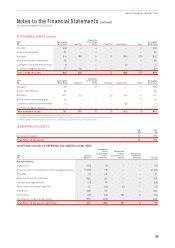
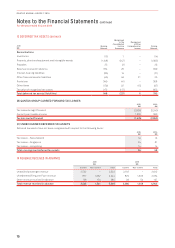
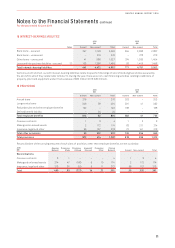
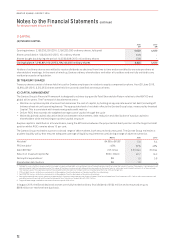
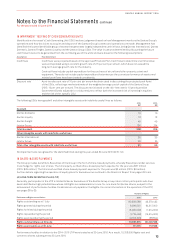
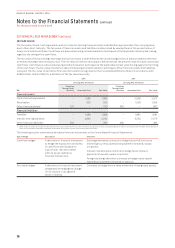
Notes to the Financial Statements continued
For the year ended 30 June 2016
2015
$M
Opening Net
Book Value Additions1
Aircraft
Operating
Lease
Refinancing Disposals Transfers2
Transferred
to Assets
Classified
as Held for
Sale Depreciation Other3
Closing Net
Book Value
Reconciliations
Freehold land 50 – – – – – – – 50
Buildings 102 – – – 29 –(10) –121
Leasehold improvements 584 56 – – (65) –(43) 7539
Plant and equipment 478 44 –(6) 36 –(81) 1472
Aircraft and engines48,473 483 –(23) 829 (42) (841) 103 8,982
Aircraft spare parts 392 44 –(4) – 6 (39) (17) 382
Aircraft deposits 421 610 –(42) (819) – – (1) 169
Total property, plant and equipment 10,500 1,237 –(75) 10 (36) (1,014) 93 10,715
1 Additions include capitalised interest of $14 million.
2 Transfers include transfers between categories of property, plant and equipment and transfers from/(to) other balance sheet accounts.
3 Other includes foreign exchange movements, non-cash additions including those relating to finance leases and impairments of property, plant and equipment.
4 Aircraft and engines include finance-leased assets with a net book value of $1,796 million.
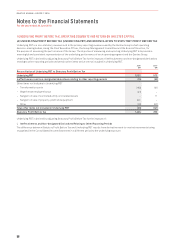
i. Aircraft by Geographic Area
Aircraft supporting the Group’s global operations are primarily located in Australia.
ii. Secured Assets
Certain aircraft and engines act as security against related financings. Under the terms of certain financing facilities entered into
by the Qantas Group, the underwriters to these agreements have a fixed charge over certain aircraft and engines to the extent
that debt has been issued directly to those underwriters. The total carrying amount of assets under pledge is $4,245 million
(2015:$4,822 million).
iii. Capital Expenditure Commitments
The Group’s capital expenditure commitments as at 30 June 2016 are $11,623 million (2015: $10,090 million). The Group has certain
rights within its aircraft purchase contracts which can defer the above capital expenditure.
The Group’s capital expenditure commitments are predominantly denominated in US dollars. Capital expenditure commitments
outlined above are translated to Australian dollar presentational currency at the 30 June 2016 closing exchange rate of
$0.75(30June 2015: $0.77).
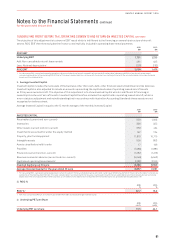
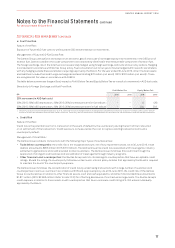
12 INTANGIBLE ASSETS
2016
$M
2015
$M
At Cost
Accumulated
Depreciation and
Impairment Net Book Value At Cost
Accumulated
Depreciation and
Impairment Net Book Value
Goodwill 208 –208 206 –206
Airport landing slots 35 –35 35 –35
Software 1,322 (720) 602 1,152 (638) 514
Brand names and trademarks 26 –26 25 –25
Customer contracts/relationships 27 (25) 227 (21) 6
Contract intangible assets 36 –36 17 –17
Total intangible assets 1,654 (745) 909 1,462 (659) 803
11 PROPERTY, PLANT AND EQUIPMENT CONTINUED
68
QANTAS ANNUAL REPORT 2016