Qantas 2016 Annual Report Download - page 4
Download and view the complete annual report
Please find page 4 of the 2016 Qantas annual report below. You can navigate through the pages in the report by either clicking on the pages listed below, or by using the keyword search tool below to find specific information within the annual report.-
 1
1 -
 2
2 -
 3
3 -
 4
4 -
 5
5 -
 6
6 -
 7
7 -
 8
8 -
 9
9 -
 10
10 -
 11
11 -
 12
12 -
 13
13 -
 14
14 -
 15
15 -
16
-
17
-
18
-
19
-
20
-
21
-
22
-
23
-
24
-
25
-
26
-
27
-
28
-
29
-
30
-
31
-
32
-
33
-
34
-
35
-
36
-
37
-
38
-
39
-
40
-
41
-
42
-
43
-
44
-
45
-
46
-
47
-
48
-
49
-
50
-
51
-
52
-
53
-
54
-
55
-
56
-
57
-
58
-
59
-
60
-
61
-
62
-
63
-
64
-
65
-
66
-
67
-
68
-
69
-
70
-
71
-
72
-
73
-
74
-
75
-
76
-
77
-
78
-
79
-
80
-
81
-
82
-
83
-
84
-
85
-
86
-
87
-
88
-
89
-
90
-
91
-
92
-
93
-
94
-
95
-
96
-
97
-
98
-
99
-
100
-
101
-
102
-
103
-
104
-
105
-
106
 |
 |
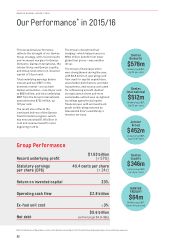
Qantas
Domestic
$578m
Underlying EBIT.
Up 20 per cent
Qantas
International
$512m
Underlying EBIT.
Up 92 per cent
Qantas
Loyalty
$346m
Underlying EBIT.
Up 10 per cent
Jetstar
Group
$452m
Underlying EBIT.
Up 97 per cent
QANTAS
FREIGHT
$64m
Underlying EBIT.
Down 44 per cent
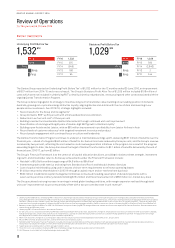
Record underlying profit $1.53 billion
( 57%)
Statutory earnings
per share (EPS) 49.4 cents per share
( 24c)
Return on invested capital 23%
Operating cash flow $2.8 billion
Ex-fuel unit cost 3%
Net debt
$5.6 billion
(within target $4.8-$6b)
Our Performance* in 2015/16
This exceptional performance
reflects the strength of our Qantas
Group strategy, with record results
and increased margins for Qantas
Domestic, Qantas International, the
Jetstar Group and Qantas Loyalty,
and Group-wide return on invested
capital of 23 per cent.
Total underlying earnings before
interest and tax (EBIT) in the
domestic market – across both
Qantas and Jetstar – rose 30 per cent
to $820 million, and total underlying
EBIT from the Group’s international
operations was $722 million, up
107 per cent.
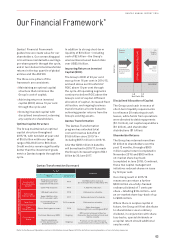
The result also reflects the
continued delivery of the Qantas
Transformation program, which
has now unlocked $1.66 billion in
cost and revenue benefits since
beginning in 2014.
The Group’s disciplined fuel
hedging – which helped secure a
$664 million benefit from lower
global fuel prices – was another
driver.
The Group’s financial position
was strengthened during the year,
with $2.8 billion in operating cash
flow used for capital expenditure,
shareholder distributions and debt
repayments, and excess cash used
for refinancing aircraft. Qantas’
strong balance sheet and more
sustainable outlook was recognised
by ratings agencies during the
financial year, with an investment
grade credit rating restored by
Standard & Poor’s and Moody’s
Investor services.
Group Performance
*Refer to the Review of Operations section in the Qantas Annual Report 2016 for definitions and explanations of non-statutory measures
02
QANTAS ANNUAL REPORT 2016