Qantas 2016 Annual Report Download - page 14
Download and view the complete annual report
Please find page 14 of the 2016 Qantas annual report below. You can navigate through the pages in the report by either clicking on the pages listed below, or by using the keyword search tool below to find specific information within the annual report.-
 1
1 -
2
-
3
-
 4
4 -
 5
5 -
 6
6 -
 7
7 -
 8
8 -
 9
9 -
 10
10 -
 11
11 -
 12
12 -
 13
13 -
 14
14 -
 15
15 -
 16
16 -
 17
17 -
 18
18 -
 19
19 -
 20
20 -
 21
21 -
 22
22 -
 23
23 -
 24
24 -
25
-
26
-
27
-
28
-
29
-
30
-
31
-
32
-
33
-
34
-
35
-
36
-
37
-
38
-
39
-
40
-
41
-
42
-
43
-
44
-
45
-
46
-
47
-
48
-
49
-
50
-
51
-
52
-
53
-
54
-
55
-
56
-
57
-
58
-
59
-
60
-
61
-
62
-
63
-
64
-
65
-
66
-
67
-
68
-
69
-
70
-
71
-
72
-
73
-
74
-
75
-
76
-
77
-
78
-
79
-
80
-
81
-
82
-
83
-
84
-
85
-
86
-
87
-
88
-
89
-
90
-
91
-
92
-
93
-
94
-
95
-
96
-
97
-
98
-
99
-
100
-
101
-
102
-
103
-
104
-
105
-
106
 |
 |

Review of Operations
For the year ended 30 June 2016
RESULT HIGHLIGHTS
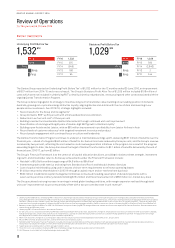
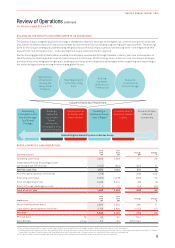
Underlying Profit Before Tax
1,532
$M
FY16
FY15
FY14
FY13
FY12
FY16 1,532
FY15 975
FY14 (646)
FY13 186
F Y12 95
Statutory Profit Before Tax
1,029
$M
FY16
FY15
FY14
FY13
FY12
FY16 1,029
FY15 560
FY14 (2,843)
FY13 2
F Y12 244
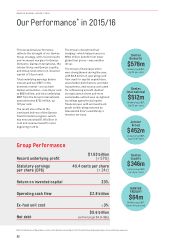
The Qantas Group reported an Underlying Profit Before Tax1 of $1,532 million for the 12 months ended 30 June 2016, an improvement
of $557 million from 2014/15 and a record result. The Group’s Statutory Profit After Tax of $1,029 million included $108 million of
costs which were not included in Underlying PBT1 primarily driven by redundancies, restructuring and other costs associated with the
ongoing Qantas Transformation Program.
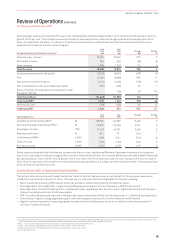
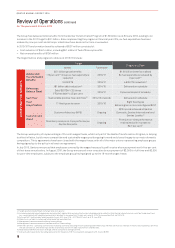
The Group is delivering against its strategy to maximise long-term shareholder value; building on our leading position in domestic
Australia, growing non-cyclical earnings at Qantas Loyalty, aligning Qantas and Jetstar with the rise of Asia and investing in our
people and our customers. Over 2015/16, strategic highlights included:
–Record results for the Group and its segments2
–Group Domestic EBIT3 up 30 per cent with enhanced dual brand coordination
–Reduction in ex-fuel unit cost4 of three per cent
–Building a resilient and sustainable Qantas International through continued unit cost improvement
–Diversification of earnings with eight years of double-digit EBIT growth at Qantas Loyalty5
–Building a pan-Asia brand at Jetstar, with an $85 million improvement in profitability from Jetstar Airlines in Asia
–Record levels of customer advocacy6 with targeted investment in service and product
–Record people engagement with continued focus on culture and leadership
The Qantas Transformation Program continues to underpin a maintainable earnings uplift, delivering $557 million of benefits over the
financial year – ahead of a targeted $450 million of benefits. Ex-fuel unit cost was reduced by three per cent, and the Group’s revenue
increased by two per cent, reflecting the cost reduction and revenue generation initiatives in the program. As a result of the program
exceeding targets to date, the Group has raised the target of Qantas Transformation to $2.1 billion of benefits delivered by the end of
financial year 2016/17, up from $2 billion.
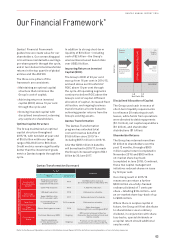
The Group’s Financial Framework is at the centre of all capital allocation decisions, providing for balance sheet strength, investment
in growth, and shareholder returns. Some key achievements under the Financial Framework include:
–Net debt7 of $5.6 billion within target range of $4.8 billion to $6 billion8
–Investment grade credit metrics and rating from Standard and Poor’s and Moody’s Investor Services
–Cost of capital minimised by using cash in excess of short-term requirements to refinance operating leases
–$1 billion returned to shareholders in 2015/16 through a capital return and on-market share buy-back
–$500 million in additional capital management initiatives announced including resumption of dividend payments with a
sevencents per share ordinary dividend totalling $134 million and the announcement of a $366 million on-market buy-back
The Group achieved a strong increase in earnings in mixed global trading conditions, with margin expansion realised through total
unit cost9 improvement of six per cent partially offset with a two per cent decrease in unit revenue10.
1 Underlying Profit Before Tax (Underlying PBT) is the primary reporting measure used by the Qantas Group’s chief operating decision-making bodies, being the Chief Executive Officer,
Group Management Committee and the Board of Directors, for the purpose of assessing the performance of the Group. The primary reporting measure of the Qantas International, Qantas
Domestic, Jetstar Group, Qantas Loyalty and Qantas Freight operating segments is Underlying Earnings Before Net Finance Costs and Tax (Underlying EBIT). The primary reporting
measure of the Corporate segment is Underlying PBT as net finance costs are managed centrally. Refer to the reconciliation of Underlying PBT to Statutory Profit/(Loss) Before Tax.
2 Based on Underlying Profit Before Tax (PBT) for the Qantas Group and Underlying EBIT (Earnings before net interest and income tax expense) for Qantas Domestic, Qantas International,
Jetstar Group and Qantas Loyalty.
3 Underlying EBIT of Qantas Domestic and Jetstar Domestic.
4 Ex-fuel unit cost is calculated as Underlying PBT less ticketed passenger revenue and fuel, adjusted for changes in: employee provision discount rates and other assumptions changes,
foreign exchange rates, share of net profit/(loss) of investments accounted for under the equity method and block codeshare flying agreements per ASK. The adjustment for foreign
exchange rates is made to the comparative year to enable comparability.
5 When normalised for changes in accounting estimates of the fair value of points and breakage expectations effective 1 January 2009.
6 Record NPS achieved at Qantas Domestic, Qantas International and Qantas Loyalty.
7 Net debt under the Group’s Financial Framework includes net on balance sheet debt and off balance sheet aircraft operating lease liabilities. Capitalised operating lease liability is
measured at fair value at the lease commencement date and remeasured over lease term on a principal and interest basis akin to a finance lease.
8 Target range calculated based on current average invested capital.
9 Total Unit cost is calculated as Underlying PBT less ticketed passenger revenue per available seat kilometre (ASK).
10 Unit Revenue is calculated as ticketed passenger revenue per ASK.
12
QANTAS ANNUAL REPORT 2016