Qantas 2013 Annual Report Download - page 94
Download and view the complete annual report
Please find page 94 of the 2013 Qantas annual report below. You can navigate through the pages in the report by either clicking on the pages listed below, or by using the keyword search tool below to find specific information within the annual report.-
 1
1 -
2
-
3
-
4
-
5
-
6
-
7
-
8
-
9
-
10
-
11
-
12
-
13
-
14
-
15
-
16
-
17
-
18
-
19
-
20
-
21
-
22
-
23
-
24
-
25
-
26
-
27
-
28
-
29
-
30
-
31
-
32
-
33
-
34
-
35
-
36
-
37
-
38
-
39
-
40
-
41
-
42
-
43
-
44
-
45
-
46
-
47
-
48
-
49
-
50
-
51
-
52
-
53
-
54
-
55
-
56
-
57
-
58
-
59
-
60
-
61
-
62
-
63
-
64
-
65
-
66
-
67
-
68
-
69
-
70
-
71
-
72
-
73
-
74
-
75
-
76
-
77
-
78
-
79
-
80
-
81
-
82
-
83
-
 84
84 -
 85
85 -
 86
86 -
 87
87 -
 88
88 -
 89
89 -
 90
90 -
 91
91 -
 92
92 -
 93
93 -
 94
94 -
 95
95 -
 96
96 -
 97
97 -
 98
98 -
 99
99 -
 100
100 -
 101
101 -
 102
102 -
 103
103 -
 104
104 -
105
-
106
-
107
-
108
-
109
-
110
-
111
-
112
-
113
-
114
-
115
-
116
-
117
-
118
-
119
-
120
-
121
-
122
-
123
-
124
-
125
-
126
-
127
-
128
-
129
-
130
-
131
-
132
-
133
-
134
-
135
-
136
-
137
-
138
-
139
-
140
-
141
-
142
-
143
-
144
-
145
-
146
-
147
-
148
-
149
-
150
-
151
-
152
-
153
-
154
-
155
-
156
-
157
-
158
-
159
-
160
-
161
-
162
-
163
-
164
-
165
-
166
-
167
-
168
-
169
-
170
-
171
-
172
-
173
-
174
-
175
-
176
-
177
-
178
-
179
-
180
-
181
-
182
-
183
-
184
 |
 |
92
Directors’ Report continued
FOR THE YEAR ENDED 30 JUNE 2013
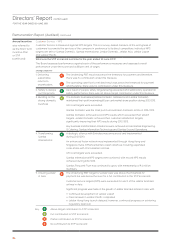
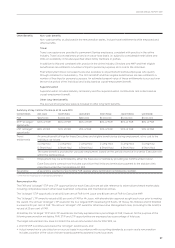
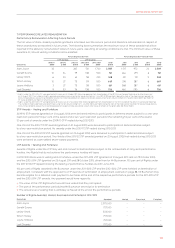
Additional Information – Share-based Payments
The following table provides a more detailed breakdown of the statutory accounting expense of share-based payments
to disclosed Executives.
$000
STIP LTIP
Total
Cash-settled
Share-based
Payment
Equity-settled
Share-based
Payment
Equity-settled
Share-based
Payment
Alan Joyce
Chief Executive Ofcer
2013 – 375 1,794 2,169
2012 1,201 962 1,134 3,297
Gareth Evans
Chief Financial Ofcer
2013 202 133 366 701
2012 358 185 194 737
Lesley Grant
CEO Qantas Loyalty
2013 139 89 162 390
2012 n/a n/a n/a n/a
Simon Hickey
CEO Qantas International
2013 159 125 280 564
2012 349 225 138 712
Jayne Hrdlicka
CEO Jetstar Group
2013 162 75 224 461
2012 115 26 48 189
Lyell Strambi
CEO Qantas Domestic
2013 193 130 366 689
2012 319 260 215 794
Total 2013 855 927 3,192 4,974
2012 2,342 1,658 1,729 5,729
Former Executive
Bruce Buchanan 2013 146 121 (217) 50
Former CEO Jetstar Group 2012 330 241 202 773
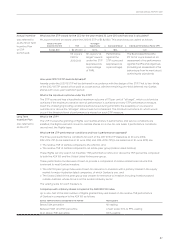
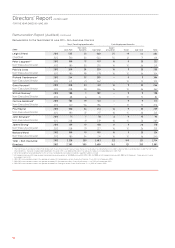
Additional Information – Methodology Used for the Remuneration Outcomes Table (Non-statutory)
Base pay (cash FAR) and other remuneration in the Remuneration Outcomes tables on pages 78 and 81 are the same as those
reported in the statutory remuneration tables on pages 79 and 82.
The STIP amount shown in the Remuneration Outcomes tables is the full value of the STIP awarded for the corresponding year
calculated as a product of FAR, At Target Opportunity, STIP Scorecard Result and Individual Performance Factor (rather than
amortising the accounting value over the relevant performance and service period as per the accounting standards).
The LTIP amount shown in the Remuneration Outcomes tables is equal to the number of Rights vested during the year multiplied
by the fair value of the Right at grant date (rather than amortising the accounting value over the relevant performance and service
period as per the accounting standards).
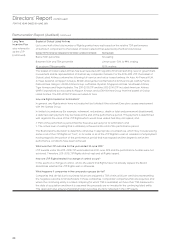
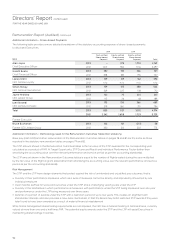
Risk Management
The STIP and the LTIP have design elements that protect against the risk of unintended and unjustied pay outcomes, that is:
»Diversity in their performance measures, which as a suite of measures cannot be directly and imprudently inuenced by one
individual employee
»Clear maxima dened for scorecard outcomes under the STIP and a challenging vesting scale under the LTIP
»Diversity in the timeframes in which performance is measured, with performance under the STIP being measured over one year
and performance under the LTIP being measured over three years
»Deferral of a portion of awards under the STIP with a restriction period of up to two years. This creates an alignment with
shareholder interests and also provides a claw-back mechanism, in that the Board may forfeit restricted STIP awards if they were
later found to have been awarded as a result of material nancial misstatement
While formal management shareholding requirements are not imposed, the CEO has a material holding in Qantas shares, currently
valued at more than one and a half times FAR. The potential equity awards under the STIP and the LTIP will assist Executives in
maintaining shareholdings in Qantas.
Remuneration Report (Audited)
c
ontinue
d