Qantas 2013 Annual Report Download - page 63
Download and view the complete annual report
Please find page 63 of the 2013 Qantas annual report below. You can navigate through the pages in the report by either clicking on the pages listed below, or by using the keyword search tool below to find specific information within the annual report.-
 1
1 -
2
-
3
-
4
-
5
-
6
-
7
-
8
-
9
-
10
-
11
-
12
-
13
-
14
-
15
-
16
-
17
-
18
-
19
-
20
-
21
-
22
-
23
-
24
-
25
-
26
-
27
-
28
-
29
-
30
-
31
-
32
-
33
-
34
-
35
-
36
-
37
-
38
-
39
-
40
-
41
-
42
-
43
-
44
-
45
-
46
-
47
-
48
-
49
-
50
-
51
-
52
-
 53
53 -
 54
54 -
 55
55 -
 56
56 -
 57
57 -
 58
58 -
 59
59 -
 60
60 -
 61
61 -
 62
62 -
 63
63 -
 64
64 -
 65
65 -
 66
66 -
 67
67 -
 68
68 -
 69
69 -
 70
70 -
 71
71 -
 72
72 -
 73
73 -
74
-
75
-
76
-
77
-
78
-
79
-
80
-
81
-
82
-
83
-
84
-
85
-
86
-
87
-
88
-
89
-
90
-
91
-
92
-
93
-
94
-
95
-
96
-
97
-
98
-
99
-
100
-
101
-
102
-
103
-
104
-
105
-
106
-
107
-
108
-
109
-
110
-
111
-
112
-
113
-
114
-
115
-
116
-
117
-
118
-
119
-
120
-
121
-
122
-
123
-
124
-
125
-
126
-
127
-
128
-
129
-
130
-
131
-
132
-
133
-
134
-
135
-
136
-
137
-
138
-
139
-
140
-
141
-
142
-
143
-
144
-
145
-
146
-
147
-
148
-
149
-
150
-
151
-
152
-
153
-
154
-
155
-
156
-
157
-
158
-
159
-
160
-
161
-
162
-
163
-
164
-
165
-
166
-
167
-
168
-
169
-
170
-
171
-
172
-
173
-
174
-
175
-
176
-
177
-
178
-
179
-
180
-
181
-
182
-
183
-
184
 |
 |

61
QANTAS ANNUAL REPORT 2013
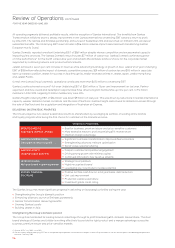
JETSTAR
»Strong position in attractive growth markets
»Best low-cost carrier Australia-Pacic41
»Continued growth in ancillary revenue per passenger
»Unit cost42 improvement
»Building a strong brand across Asia
»Leading low-cost technology and customer offering
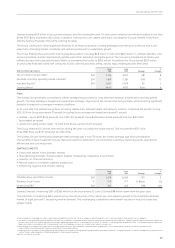
June
2013
June
2012 Change
%
Change
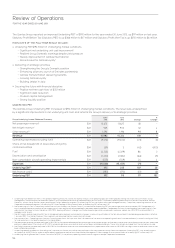
Total Revenue and Other Income $M 3,288 3,076 212 7
Seat Factor % 79.1 79.2 (0.1)pts (0.1)
Underlying EBIT $M 138 203 (65) (32)
Jetstar Underlying EBIT for year ended 30 June 2013 is $138 million, down $65 million from the prior corresponding period.
The decline in earnings was primarily driven by start up losses from Jetstar Japan and Jetstar Hong Kong, introduction of the
carbon tax and excessive domestic market capacity. Jetstar’s revenue growth has been supported by increasedcapacity
(seven per cent) and passengers (nine per cent), coupled with Jetstar’s continued focus on ancillary revenue.
Jetstar has been protable every year since launch and awarded best low-cost carrier in Australia-Pacic41 for the third consecutive
year. Jetstar continued to grow its ancillary revenue per passenger (up ve per cent43).
Jetstar improved unit cost42 by three per cent compared to last year retaining its low-cost carrier margin advantage.
Jetstar Asia continues to build a strong brand, with 10 per cent passenger growth in an increasingly competitive market. Jetstar Asia
delivered its second consecutive year of protability44.
Jetstar Pacic has successfully completed its eet renewal program. It is now ying ve A320-200s with an average eet age
of eight years. This has delivered a signicant improvement in eet economics, resulting in unit cost improvement. Jetstar Pacic
has planned growth to 15 aircraft by nancial year 2016/2017.
Jetstar will be the rst low-cost carrier in the Asia-Pacic to y the B787-8 Dreamliner, with the rst ight planned by the end of the
2013 calendar year. There are currently seven A320-200s across the Jetstar-branded airlines tted with fuel-saving sharklets.
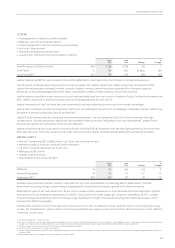
QANTAS LOYALTY
»Record45 Underlying EBIT of $260 million, up 13 per cent on the prior year
»Member growth of nine per cent to 9.4 million members
»5.6 million awards redeemed, up 10 per cent
»Billings up to $1.2 billion
»Qantas Cash launching
»Net promoter score at record high46
June
2013
June
2012 Change
%
Change
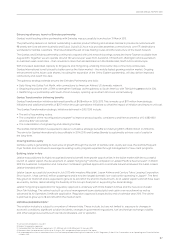
Members M 9.4 8.6 0.8 9
Awards Redeemed M5.6 5.10.5 10
Underlying EBIT $M 260 231 29 13
Qantas Loyalty achieved another record45 result with a 13 per cent improvement in Underlying EBIT to $260 million. This has
beendriven by strong billings, record member engagement46 and continued member growth to 9.4 million members.
Redemptions grew 10 per cent driven by a 33 per cent increase in store awards due to Auto Rewards and new redemption options.
New options include charitable redemptions to UNICEF, David Jones Gift Cards, digital gift cards (including Myer, JB Hi-Fi, Jetstar,
iTunes) and popular additions to the technology range. Redemption margins increased following improvements to supply chain
following the Wishlist acquisition.
Qantas Cash was announced in the year and is due to launch in 2013. In addition to faster, smarter check-in, boarding and lounge
access, the prepaid multi-currency travel card will give members new ways to earn points and the ability to hold up to nine different
currencies on one card.
41 SKYTRAX Awards 2013 – Jetstar Airways.
42 Unit cost – Jetstar unit cost is measured using controllable unit cost in line with industry benchmarks for low cost carriers. Controllable unit cost is measured as total expenses excluding
fuel per ASK. Expenses relating to carbon tax, Jetstar Asia and Jetstar-branded associates are excluded to aid comparability between reporting periods.
43 Jetstar ancillary revenue excluding Jetstar Asia and Jetstar-branded associates.
44 Underlying EBIT contribution to Jetstar Group result.
45 Qantas Loyalty record Underlying EBIT result compared to prior periods normalised for changes in accounting estimates of the fair value of points and breakage expectations effective
1January 2009.
46 Net promoter score is at its highest level since reporting started in 2008.