Qantas 2013 Annual Report Download - page 144
Download and view the complete annual report
Please find page 144 of the 2013 Qantas annual report below. You can navigate through the pages in the report by either clicking on the pages listed below, or by using the keyword search tool below to find specific information within the annual report.-
 1
1 -
2
-
3
-
4
-
5
-
6
-
7
-
8
-
9
-
10
-
11
-
12
-
13
-
14
-
15
-
16
-
17
-
18
-
19
-
20
-
21
-
22
-
23
-
24
-
25
-
26
-
27
-
28
-
29
-
30
-
31
-
32
-
33
-
34
-
35
-
36
-
37
-
38
-
39
-
40
-
41
-
42
-
43
-
44
-
45
-
46
-
47
-
48
-
49
-
50
-
51
-
52
-
53
-
54
-
55
-
56
-
57
-
58
-
59
-
60
-
61
-
62
-
63
-
64
-
65
-
66
-
67
-
68
-
69
-
70
-
71
-
72
-
73
-
74
-
75
-
76
-
77
-
78
-
79
-
80
-
81
-
82
-
83
-
84
-
85
-
86
-
87
-
88
-
89
-
90
-
91
-
92
-
93
-
94
-
95
-
96
-
97
-
98
-
99
-
100
-
101
-
102
-
103
-
104
-
105
-
106
-
107
-
108
-
109
-
110
-
111
-
112
-
113
-
114
-
115
-
116
-
117
-
118
-
119
-
120
-
121
-
122
-
123
-
124
-
125
-
126
-
127
-
128
-
129
-
130
-
131
-
132
-
133
-
 134
134 -
 135
135 -
 136
136 -
 137
137 -
 138
138 -
 139
139 -
 140
140 -
 141
141 -
 142
142 -
 143
143 -
 144
144 -
 145
145 -
 146
146 -
 147
147 -
 148
148 -
 149
149 -
 150
150 -
 151
151 -
 152
152 -
 153
153 -
 154
154 -
155
-
156
-
157
-
158
-
159
-
160
-
161
-
162
-
163
-
164
-
165
-
166
-
167
-
168
-
169
-
170
-
171
-
172
-
173
-
174
-
175
-
176
-
177
-
178
-
179
-
180
-
181
-
182
-
183
-
184
 |
 |

142
Qantas Group
2013
$M
2012
$M
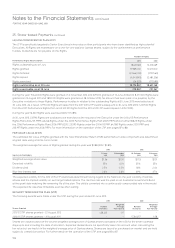
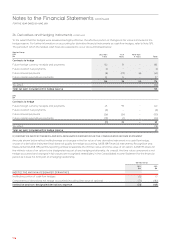
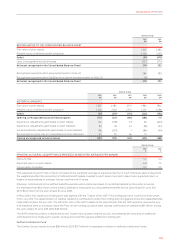
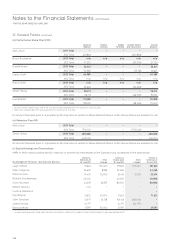
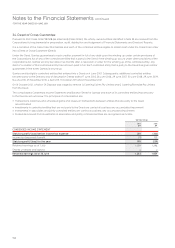
CHANGES IN THE PRESENT VALUE OF DEFINED BENEFIT OBLIGATION
Opening dened benet obligation 2,561 2,274
Current service cost 162 154
Interest cost 99 106
Actuarial (gains)/losses (279) 183
Exchange differences on foreign plans 11 3
Benets paid (215) (159)
Liabilities acquired in a business combination 87 –
Closing dened benet obligation 2,426 2,561
CHANGES IN THE FAIR VALUE OF PLAN ASSETS
Opening fair value of plan assets 2,082 2,101
Expected return 143 151
Actuarial gains/(losses) 106 (178)
Exchange differences on foreign plans 11 2
Contributions by employer 135 138
Contributions by plan participants 26 27
Benets paid (215) (159)
Assets acquired in a business combination 79 –
Closing fair value of plan assets 2,367 2,082
EXPENSE RECOGNISED IN THE CONSOLIDATED INCOME STATEMENT
Gross service cost 144 137
Plan expenses 45
Increase in allowance for contributions tax on net liability 14 12
Interest cost 99 106
Contributions by plan participants (26) (27)
Expected return on plan assets (143) (151)
Actuarial losses 50 20
Total expense included in manpower and staff related expenditure 142 102
ACTUAL RETURN GAIN/LOSS ON PLAN ASSETS
Actual return gain/(loss) on plan assets 249 (27)
MAJOR CATEGORIES OF PLAN ASSETS AS A PERCENTAGE OF TOTAL PLAN ASSETS %%
Equity instruments (Australian and overseas) 50 50
Fixed interest, cash and indexed bonds (Australian and overseas) 30 30
Property 55
Alternative assets 15 15
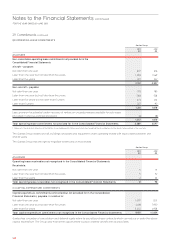
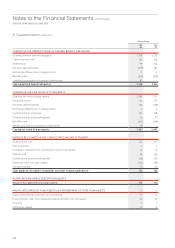
Notes to the Financial Statements continued
FOR THE YEAR ENDED 30 JUNE 2013
31. Superannuation continued