Qantas 2013 Annual Report Download - page 118
Download and view the complete annual report
Please find page 118 of the 2013 Qantas annual report below. You can navigate through the pages in the report by either clicking on the pages listed below, or by using the keyword search tool below to find specific information within the annual report.-
 1
1 -
2
-
3
-
4
-
5
-
6
-
7
-
8
-
9
-
10
-
11
-
12
-
13
-
14
-
15
-
16
-
17
-
18
-
19
-
20
-
21
-
22
-
23
-
24
-
25
-
26
-
27
-
28
-
29
-
30
-
31
-
32
-
33
-
34
-
35
-
36
-
37
-
38
-
39
-
40
-
41
-
42
-
43
-
44
-
45
-
46
-
47
-
48
-
49
-
50
-
51
-
52
-
53
-
54
-
55
-
56
-
57
-
58
-
59
-
60
-
61
-
62
-
63
-
64
-
65
-
66
-
67
-
68
-
69
-
70
-
71
-
72
-
73
-
74
-
75
-
76
-
77
-
78
-
79
-
80
-
81
-
82
-
83
-
84
-
85
-
86
-
87
-
88
-
89
-
90
-
91
-
92
-
93
-
94
-
95
-
96
-
97
-
98
-
99
-
100
-
101
-
102
-
103
-
104
-
105
-
106
-
107
-
 108
108 -
 109
109 -
 110
110 -
 111
111 -
 112
112 -
 113
113 -
 114
114 -
 115
115 -
 116
116 -
 117
117 -
 118
118 -
 119
119 -
 120
120 -
 121
121 -
 122
122 -
 123
123 -
 124
124 -
 125
125 -
 126
126 -
 127
127 -
 128
128 -
129
-
130
-
131
-
132
-
133
-
134
-
135
-
136
-
137
-
138
-
139
-
140
-
141
-
142
-
143
-
144
-
145
-
146
-
147
-
148
-
149
-
150
-
151
-
152
-
153
-
154
-
155
-
156
-
157
-
158
-
159
-
160
-
161
-
162
-
163
-
164
-
165
-
166
-
167
-
168
-
169
-
170
-
171
-
172
-
173
-
174
-
175
-
176
-
177
-
178
-
179
-
180
-
181
-
182
-
183
-
184
 |
 |

116
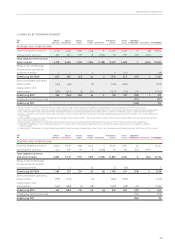
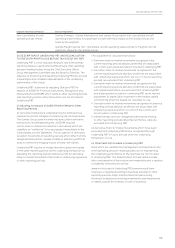
(iii) Underlying EBIT
Underlying EBIT is calculated using a consistent methodology as outlined above but excluding the impact of statutory net nance
costs and ineffective and non-designated derivatives relating to other reporting periods affecting net nance costs.
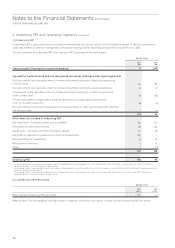
The reconciliation of Underlying PBT from Statutory PBT is detailed in the table below.
Qantas Group
2013
$M
2012
$M
Statutory prot/(loss) before income tax expense 17 (349)
Adjusted for ineffectiveness and non-designated derivatives relating to other reporting periods
Exclude current year derivative mark-to-market movements relating to underlying exposures
in future years 26 86
Exclude current year derivative mark-to-market movements relating to capital expenditure 12 9
Include prior years’ derivative mark-to-market movements relating to underlying exposures
in the current year (71) (51)
Include adjustment to depreciation expense relating to excluded capital expenditure
mark-to-market movements (6) (4)
Exclude ineffective and non-designated derivatives relating to other reporting periods affecting
net nance costs 76
(32) 46
Other items not included in Underlying PBT
Net impairment of property, plant and equipment186 147
Redundancies and restructuring2118 203
Impairment of goodwill and other intangible assets324 18
Net prot on disposal of investment in jointly controlled entity (30) –
Net impairment of investments (2) 19
Write down of inventory 413
Other 7(2)
207 398
Underlying PBT 192 95
1 As disclosed in Note 3, net impairment of property, plant and equipment for the year ended 30 June 2013 was $93 million (2012: $157 million), of which $86 million (2012: $147 million) is
presented as other items not included in Underlying PBT.
2 As disclosed in Note 3, redundancies and restructuring for the year ended 30 June 2013 was $122 million (2012: $206 million), of which $118 million (2012: $203 million) is presented as other
items not included in Underlying PBT.
3 As disclosed in Note 3, net impairment of goodwill and intangible assets for the year ended 30 June 2013 was $24 million (2012: $20 million), of which $24 million (2012: $18 million) is
presented as other items not included in Underlying PBT.
E UNDERLYING PBT PER SHARE
Qantas Group
2013
cents
2012
cents
Basic/diluted Underlying PBT per share 8.5 4.2
Refer to Note 7 for the weighted average number of shares used in the calculation of basic/diluted Underlying PBT per share.
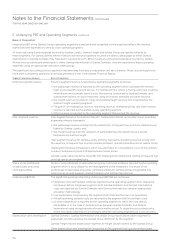
2. Underlying PBT and Operating Segments
continue
d
Notes to the Financial Statements continued
FOR THE YEAR ENDED 30 JUNE 2013