Qantas 2013 Annual Report Download - page 58
Download and view the complete annual report
Please find page 58 of the 2013 Qantas annual report below. You can navigate through the pages in the report by either clicking on the pages listed below, or by using the keyword search tool below to find specific information within the annual report.-
 1
1 -
2
-
3
-
4
-
5
-
6
-
7
-
8
-
9
-
10
-
11
-
12
-
13
-
14
-
15
-
16
-
17
-
18
-
19
-
20
-
21
-
22
-
23
-
24
-
25
-
26
-
27
-
28
-
29
-
30
-
31
-
32
-
33
-
34
-
35
-
36
-
37
-
38
-
39
-
40
-
41
-
42
-
43
-
44
-
45
-
46
-
47
-
 48
48 -
 49
49 -
 50
50 -
 51
51 -
 52
52 -
 53
53 -
 54
54 -
 55
55 -
 56
56 -
 57
57 -
 58
58 -
 59
59 -
 60
60 -
 61
61 -
 62
62 -
 63
63 -
 64
64 -
 65
65 -
 66
66 -
 67
67 -
 68
68 -
69
-
70
-
71
-
72
-
73
-
74
-
75
-
76
-
77
-
78
-
79
-
80
-
81
-
82
-
83
-
84
-
85
-
86
-
87
-
88
-
89
-
90
-
91
-
92
-
93
-
94
-
95
-
96
-
97
-
98
-
99
-
100
-
101
-
102
-
103
-
104
-
105
-
106
-
107
-
108
-
109
-
110
-
111
-
112
-
113
-
114
-
115
-
116
-
117
-
118
-
119
-
120
-
121
-
122
-
123
-
124
-
125
-
126
-
127
-
128
-
129
-
130
-
131
-
132
-
133
-
134
-
135
-
136
-
137
-
138
-
139
-
140
-
141
-
142
-
143
-
144
-
145
-
146
-
147
-
148
-
149
-
150
-
151
-
152
-
153
-
154
-
155
-
156
-
157
-
158
-
159
-
160
-
161
-
162
-
163
-
164
-
165
-
166
-
167
-
168
-
169
-
170
-
171
-
172
-
173
-
174
-
175
-
176
-
177
-
178
-
179
-
180
-
181
-
182
-
183
-
184
 |
 |

56
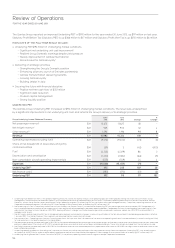
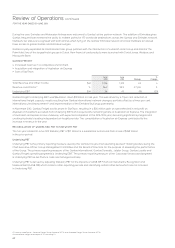
All operating segments delivered protable results, with the exception of Qantas International. The benets from Qantas
Transformation initiatives drove a steady improvement in the Qantas International Underlying EBIT toward a return to prot
by 2014/2015. TheQantas and Emirates partnership announced in September 2012 and launched on 31 March 2013, will deliver
substantial benets. TheUnderlying EBIT result includes a $56 million adverse impact associated with transitioning Qantas’
European hub to Dubai.
Qantas Domestic reported a resilient Underlying EBIT of $365 million despite intense competition and excess market capacity
impacting yield and load. The Qantas Domestic result includes $77 million of carbon tax. Qantas Domestic achieved superior
on-time performance17 for the fourth consecutive year and remains the domestic airline of choice for the corporate market
supported by continuing network and product enhancements.
Jetstar achieved a seven per cent increase in revenue while advancing its strategy of growth in Asia. Jetstar’s full-year Underlying
EBIT of $138 million reects the impact of domestic competitive pressures, $29 million of carbon tax and $50 million in associate
start-up losses to position Jetstar for success in Asia through its Jetstar-branded airlines in Jetstar Japan, Jetstar Hong Kong
andJetstar Pacic.
Overall, the Qantas Group’s domestic operations contributed more than $450 million to Underlying EBIT.
Qantas Loyalty achieved a record18 full-year Underlying EBIT of $260 million, a 13 per cent improvement on last year. Partner
expansion and new award andredemption opportunities have driven program membership up nine per cent, to 9.4 million
members in2012/2013, targeting 10 million members by June 2014.
Qantas Freight Underlying EBIT of $36 million was down $9 million on last year. This was driven by reductions in Qantas International
capacity, weaker domestic market conditions and the sale of StarTrack. Qantas Freight restructured its domestic business through
the sale of StarTrack and the acquisition and integration of Australian air Express.
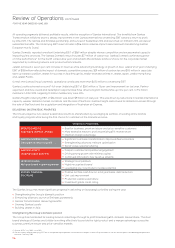
DELIVERING ON STRATEGIC PRIORITIES
The Group’s objective is to deliver sustainable returns to shareholders by leveraging its portfolio of leading airline brands
andloyalty program while being the rst choice for customers in the markets we serve.
STRATEGIC PRIORITIES
GROUP DOMESTIC
Dual brand (Qantas, Jetstar)
»Best for business, premium leisure and price-sensitive customers
»Most extensive network; prot maximising 65% market share
»Maintain margin advantage
QANTAS INTERNATIONAL
Clear path to return to prot
»Signicant cost base transformation; improved eet economics
»Strengthening alliances; network optimisation
»World-class customer offering
QANTAS LOYALTY
Leading loyalty business
»Deepen customer and partner engagement
»Driving strong growth with minimal capital
»Continued innovation; new revenue streams
JETSTAR IN ASIA
Well positioned in growing market
»Strategic local partners
»Highly recognised brand
»Leveraging low-cost model to realise potential
STRONG FINANCIAL
DISCIPLINE
»Positive net free cash ow on a full year basis; debt reduction
»Unit cost improvement
»Prudential capital expenditure
»Investment grade credit rating
The Qantas Group has made signicant progress in delivering on its strategic priorities during the year.
»Strengthening the Group’s domestic position
»Enhancing alliances, launch of Emirates partnership
»Qantas Transformation delivering benets
»Growing Qantas Loyalty
»Building Jetstar in Asia
Strengthening the Group’s domestic position
The Group has maintained its leading network advantage through its prot maximising 65% domestic market share. The dual
brandstrategy of Qantas and Jetstar is working effectively to provide the right product and a margin advantage across the
business, premium leisure and price-sensitive markets.
Review of Operations continued
FOR THE YEAR ENDED 30 JUNE 2013
17 Source: BITRE July 2009-June 2013.
18 Qantas Loyalty record Underlying EBIT result compared to prior periods normalised for changes in accounting estimates of the fair value of points and breakage expectations
effective 1 January 2009.