Qantas 2013 Annual Report Download - page 119
Download and view the complete annual report
Please find page 119 of the 2013 Qantas annual report below. You can navigate through the pages in the report by either clicking on the pages listed below, or by using the keyword search tool below to find specific information within the annual report.-
 1
1 -
2
-
3
-
4
-
5
-
6
-
7
-
8
-
9
-
10
-
11
-
12
-
13
-
14
-
15
-
16
-
17
-
18
-
19
-
20
-
21
-
22
-
23
-
24
-
25
-
26
-
27
-
28
-
29
-
30
-
31
-
32
-
33
-
34
-
35
-
36
-
37
-
38
-
39
-
40
-
41
-
42
-
43
-
44
-
45
-
46
-
47
-
48
-
49
-
50
-
51
-
52
-
53
-
54
-
55
-
56
-
57
-
58
-
59
-
60
-
61
-
62
-
63
-
64
-
65
-
66
-
67
-
68
-
69
-
70
-
71
-
72
-
73
-
74
-
75
-
76
-
77
-
78
-
79
-
80
-
81
-
82
-
83
-
84
-
85
-
86
-
87
-
88
-
89
-
90
-
91
-
92
-
93
-
94
-
95
-
96
-
97
-
98
-
99
-
100
-
101
-
102
-
103
-
104
-
105
-
106
-
107
-
108
-
 109
109 -
 110
110 -
 111
111 -
 112
112 -
 113
113 -
 114
114 -
 115
115 -
 116
116 -
 117
117 -
 118
118 -
 119
119 -
 120
120 -
 121
121 -
 122
122 -
 123
123 -
 124
124 -
 125
125 -
 126
126 -
 127
127 -
 128
128 -
 129
129 -
130
-
131
-
132
-
133
-
134
-
135
-
136
-
137
-
138
-
139
-
140
-
141
-
142
-
143
-
144
-
145
-
146
-
147
-
148
-
149
-
150
-
151
-
152
-
153
-
154
-
155
-
156
-
157
-
158
-
159
-
160
-
161
-
162
-
163
-
164
-
165
-
166
-
167
-
168
-
169
-
170
-
171
-
172
-
173
-
174
-
175
-
176
-
177
-
178
-
179
-
180
-
181
-
182
-
183
-
184
 |
 |
117
QANTAS ANNUAL REPORT 2013
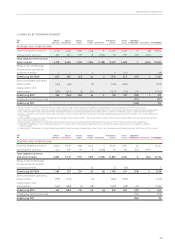
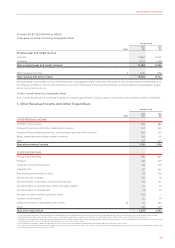
F ANALYSIS BY GEOGRAPHICAL AREAS
(i) Revenue and other Income by Geographic Areas
Qantas Group
Notes
2013
$M
2012
$M
Net passenger and freight revenue
Australia 10,864 10,447
Overseas 3,744 4,081
Total net passenger and freight revenue 14,608 14,528
Other revenue/income 3 1,294 1,196
Total revenue and other income 15,902 15,724
Net passenger and freight revenue is attributed to a geographic region based on the point of sale except where this information is
not directly available in which case allocation is on a pro rata basis. Other revenue/income is not allocated to a geographic region
as it is impractical to do so.
(ii) Non-current Assets by Geographic Areas
Non-current assets which consist principally of aircraft supporting the Groups’ global operations, are primarily located in Australia.
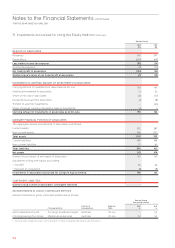
3. Other Revenue/Income and Other Expenditure
Qantas Group
Notes
2013
$M
2012
$M
OTHER REVENUE/INCOME1
Contract work revenue 296
380
Frequent Flyer store and other redemption revenue
2
257
245
Frequent Flyer marketing revenue
2
, membership fees and other revenue 268
235
Retail, advertising and other property revenue 148
131
Other 325
205
Total other revenue/income 1,294 1,196
OTHER EXPENDITURE
Selling and marketing 598 635
Property 482 429
Computer and communication 418 437
Capacity hire 311 266
Redundancies and restructuring 122 206
Airport security charges 145 131
Net impairment of property, plant and equipment
3
93 157
Net impairment of goodwill and other intangible assets
4
24 20
Net impairment of investments (2) 19
Net gain on sale of jointly controlled entity (30) –
Contract work material 65 79
Ineffective and non-designated derivatives 26 76 165
Other 337 449
Total other expenditure 2,639 2,993
1 During the year the Qantas Group restated the Consolidated Income Statement for the reclassication of ancillary passenger revenue, passenger service fees, lease revenue from
codeshare and charter revenue from Other revenue to Net passenger revenue and reclassication of freight lease revenue from Other revenue to Net freight revenue.
2 Frequent Flyer redemption revenue excludes redemptions on Qantas Group’s ights which are reported as net passenger revenue in the Consolidated Income Statement. Frequent Flyer
marketing revenue is net of intra-group marketing revenue within the Qantas Group.
3 Net impairment of property, plant and equipment arises from assets classied as held for sale and recognised at fair value less costs to sell.
4 Net impairment of goodwill and other intangible assets arises from obsolete software (2012 – Cairns and Riverside catering disposal group classied as assets and liabilities held for sale
and recognised at fair value less costs to sell).