Qantas 2013 Annual Report Download - page 56
Download and view the complete annual report
Please find page 56 of the 2013 Qantas annual report below. You can navigate through the pages in the report by either clicking on the pages listed below, or by using the keyword search tool below to find specific information within the annual report.-
 1
1 -
2
-
3
-
4
-
5
-
6
-
7
-
8
-
9
-
10
-
11
-
12
-
13
-
14
-
15
-
16
-
17
-
18
-
19
-
20
-
21
-
22
-
23
-
24
-
25
-
26
-
27
-
28
-
29
-
30
-
31
-
32
-
33
-
34
-
35
-
36
-
37
-
38
-
39
-
40
-
41
-
42
-
43
-
44
-
45
-
 46
46 -
 47
47 -
 48
48 -
 49
49 -
 50
50 -
 51
51 -
 52
52 -
 53
53 -
 54
54 -
 55
55 -
 56
56 -
 57
57 -
 58
58 -
 59
59 -
 60
60 -
 61
61 -
 62
62 -
 63
63 -
 64
64 -
 65
65 -
 66
66 -
67
-
68
-
69
-
70
-
71
-
72
-
73
-
74
-
75
-
76
-
77
-
78
-
79
-
80
-
81
-
82
-
83
-
84
-
85
-
86
-
87
-
88
-
89
-
90
-
91
-
92
-
93
-
94
-
95
-
96
-
97
-
98
-
99
-
100
-
101
-
102
-
103
-
104
-
105
-
106
-
107
-
108
-
109
-
110
-
111
-
112
-
113
-
114
-
115
-
116
-
117
-
118
-
119
-
120
-
121
-
122
-
123
-
124
-
125
-
126
-
127
-
128
-
129
-
130
-
131
-
132
-
133
-
134
-
135
-
136
-
137
-
138
-
139
-
140
-
141
-
142
-
143
-
144
-
145
-
146
-
147
-
148
-
149
-
150
-
151
-
152
-
153
-
154
-
155
-
156
-
157
-
158
-
159
-
160
-
161
-
162
-
163
-
164
-
165
-
166
-
167
-
168
-
169
-
170
-
171
-
172
-
173
-
174
-
175
-
176
-
177
-
178
-
179
-
180
-
181
-
182
-
183
-
184
 |
 |

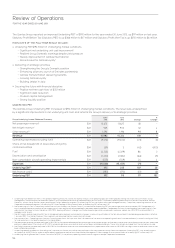
54
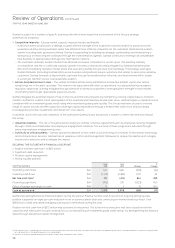
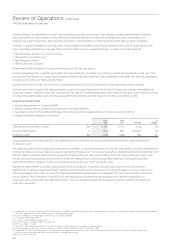
The Qantas Group reported an improved Underlying PBT1 of $192 million for the year ended 30 June 2013, up $97 million on last year.
Statutory Prot Before Tax (Statutory PBT) is up $366 million to $17 million and Statutory Prot After Tax is up $250 million to $6 million.
HIGHLIGHTS OF THE FULLYEAR RESULT INCLUDE:
»Underlying PBT $192 million in challenging market conditions
— Signicant net underlying unit cost improvement2
— Resilient Group Domestic earnings despite yield pressure
— Steady improvement in Qantas International
— Record result for Qantas Loyalty3
»Delivering on strategic priorities
— Strengthening the Group’s Domestic position
— Enhancing alliances, launch of Emirates partnership
— Qantas Transformation delivering benets
— Growing Qantas Loyalty
— Building Jetstar in Asia
»Securing the future with nancial discipline
— Positive net free cash ow4 of $372 million
— Signicant debt reduction
— Prudent capital management
— Strong liquidity position
UNDERLYING PBT
The Qantas Group Underlying PBT increased to $192 million in challenging market conditions. The result was underpinned
by asignicant improvement in net underlying unit cost2 and reects the Group’s delivery of its strategic priorities.
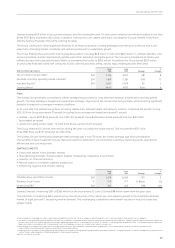
Group Underlying Income Statement Summary June
2013
June
2012 Change
%
Change
Net passenger revenue5$M 13,673 13,625 48 –
Net freight revenue6$M 935 903 32 4
Other revenue5,6 $M 1,294 1,196 98 8
Revenue $M 15,902 15,724 178 1
Operating expenses (excluding fuel)7$M (9,273) (9,200) (73) (1)
Share of net (loss)/prot of associates and jointly
controlled entities $M (39) 3 (42) >(100)
Fuel7$M (4,243) (4,329) 86 2
Depreciation and amortisation $M (1,450) (1,384) (66) (5)
Non-cancellable aircraft operating lease rentals $M (525) (549) 24 4
Expenses $M (15,530) (15,459) (71) –
Underlying EBIT8$M 372 265 107 40
Net nance costs7$M (180) (170) (10) (6)
Underlying PBT $M 192 95 97 102
1 Underlying Prot Before Tax (PBT) is the primary reporting measure used by the Qantas Group’s chief operating decision-making bodies, being the Chief Executive Ofcer, Group
Management Committee and the Board of Directors, for the purpose of assessing the performance of the Group. The primary reporting measure of the Qantas International, Qantas
Domestic, Jetstar Group, Qantas Loyalty and Qantas Freight operating segments is Underlying EBIT as net nance costs are managed centrally. The primary reporting measure of the
Corporate/Unallocated segment is Underlying PBT. Refer to page 62 for a reconciliation of Underlying PBT to Statutory PBT.
2 Net Underlying Unit Cost is the primary measure of unit cost used by the Qantas Group. It is measured as Underlying PBT less passenger revenue and fuel per ASK. Comparable unit
cost is also provided as a measure of net underlying unit cost adjusted to aid comparability between reporting periods. Comparable unit cost is calculated as Net Underlying Unit Cost
adjusted for the impact of industrial action (2011/2012), Boeing settlement, change in estimate of passenger revenue received in advance, carbon tax (2012/2013) and movements in
average sector length.
3 Qantas Loyalty record Underlying EBIT result compared to prior periods normalised for changes in accounting estimates of the fair value of points and breakage expectations effective
1January 2009. The Qantas Frequent Flyer segment was renamed Qantas Loyalty during the year.
4 Net free cash ow – Operating cash ows less investing cash ows. Net free cash ow is a measure of the amount of operating cash ows that are available (i.e. after investing activities)
to fund reductions in net debt or payments to shareholders.
5 Net passenger revenue has been adjusted in 2012/2013 to include associated ancillary passenger revenue, passenger service fees, charter revenue and lease revenue from codeshare
previously reported as Other revenue. 2011/2012 net passenger revenue and other revenue has been restated accordingly. These items remain excluded from the calculation of yield.
6 Net Freight revenue has been adjusted in 2012/2013 to include lease revenue from codeshare previously reported as other revenue. 2011/2012 net freight revenue and other revenue has
been restated accordingly.
7 Underlying operating expenses (excluding fuel), fuel and net nance costs differ from equivalent statutory expenses due to items excluded from Underlying PBT, such as adjustments
for impacts of AASB 139 which relate to other reporting periods and other items identied by Management. Refer to page 62 for a reconciliation of Underlying PBT to Statutory PBT.
8 Underlying Earning Before Net Finance Costs and Tax (EBIT) is the primary reporting measure for all segments except Corporate/Unallocated.
Review of Operations
FOR THE YEAR ENDED 30 JUNE 2013