Qantas 2013 Annual Report Download - page 129
Download and view the complete annual report
Please find page 129 of the 2013 Qantas annual report below. You can navigate through the pages in the report by either clicking on the pages listed below, or by using the keyword search tool below to find specific information within the annual report.-
 1
1 -
2
-
3
-
4
-
5
-
6
-
7
-
8
-
9
-
10
-
11
-
12
-
13
-
14
-
15
-
16
-
17
-
18
-
19
-
20
-
21
-
22
-
23
-
24
-
25
-
26
-
27
-
28
-
29
-
30
-
31
-
32
-
33
-
34
-
35
-
36
-
37
-
38
-
39
-
40
-
41
-
42
-
43
-
44
-
45
-
46
-
47
-
48
-
49
-
50
-
51
-
52
-
53
-
54
-
55
-
56
-
57
-
58
-
59
-
60
-
61
-
62
-
63
-
64
-
65
-
66
-
67
-
68
-
69
-
70
-
71
-
72
-
73
-
74
-
75
-
76
-
77
-
78
-
79
-
80
-
81
-
82
-
83
-
84
-
85
-
86
-
87
-
88
-
89
-
90
-
91
-
92
-
93
-
94
-
95
-
96
-
97
-
98
-
99
-
100
-
101
-
102
-
103
-
104
-
105
-
106
-
107
-
108
-
109
-
110
-
111
-
112
-
113
-
114
-
115
-
116
-
117
-
118
-
 119
119 -
 120
120 -
 121
121 -
 122
122 -
 123
123 -
 124
124 -
 125
125 -
 126
126 -
 127
127 -
 128
128 -
 129
129 -
 130
130 -
 131
131 -
 132
132 -
 133
133 -
 134
134 -
 135
135 -
 136
136 -
 137
137 -
 138
138 -
 139
139 -
140
-
141
-
142
-
143
-
144
-
145
-
146
-
147
-
148
-
149
-
150
-
151
-
152
-
153
-
154
-
155
-
156
-
157
-
158
-
159
-
160
-
161
-
162
-
163
-
164
-
165
-
166
-
167
-
168
-
169
-
170
-
171
-
172
-
173
-
174
-
175
-
176
-
177
-
178
-
179
-
180
-
181
-
182
-
183
-
184
 |
 |

127
QANTAS ANNUAL REPORT 2013
Qantas Group
2013
$M
2012
$M
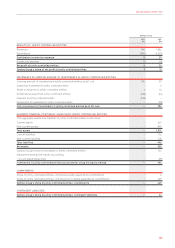
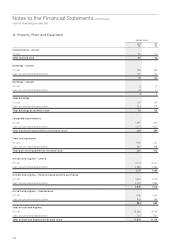
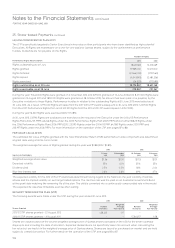
Aircraft spare parts – owned
At cost 862 852
Less: accumulated depreciation 447 414
415 438
Aircraft spare parts – leased
At cost 23 23
Less: accumulated depreciation 21 19
24
Total aircraft spare parts
At cost 885 875
Less: accumulated depreciation 468 433
Total aircraft spare parts at net book value 417 442
Aircraft deposits
At cost 1,015 1,131
Total aircraft deposits 1,015 1,131
Total property, plant and equipment
At cost 23,944 24,212
Less: accumulated depreciation 10,117 10,073
Total property, plant and equipment at net book value 13,827 14,139
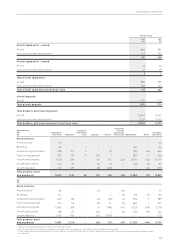
Qantas Group
2013
$M
Opening Net
Book Value Additions1
Acquisition
of Controlled
Entity Disposals Transfers
2
Transferred
to Assets
Classied as
Held for Sale Depreciation Other3
Closing Net
Book Value
Reconciliations
Freehold land 50–––––––50
Buildings 126–––––(12)–114
Leasehold improvements 589 107 5 – (5) – (52) (24) 620
Plant and equipment 523 85 15 (10) 1 – (83) 5 536
Aircraft and engines 11,278 493 – (11) 572 (26) (1,175) (56) 11,075
Aircraft spare parts 442 49 – (2) (9) – (61) (2) 417
Aircraft deposits 1,131 499 – (8) (673) – – 66 1,015
Total property, plant
andequipment 14,139 1,233 20 (31) (114) (26) (1,383) (11) 13,827
2012
$M
Reconciliations
Freehold land 66 – – (1) – (15) – – 50
Buildings 144–––2(2)(13)(5)126
Leasehold improvements 605 88 – (2) (53) (1) (53) 5 589
Plant and equipment 504 56 – (9) 52 (2) (82) 4 523
Aircraft and engines 10,462 618 – (1) 1,498 (47) (1,123) (129) 11,278
Aircraft spare parts 468 65 – (21) 1 (2) (54) (15) 442
Aircraft deposits 1,403 1,411 – (12) (1,671) – – – 1,131
Total property, plant
andequipment 13,652 2,238 – (46) (171) (69) (1,325) (140) 14,139
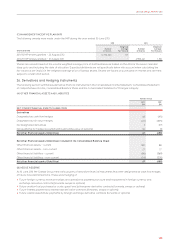
1 Additions include capitalised interest of $61 million (2012: $82 million).
2 Transfers includes transfers between categories of property, plant and equipment and transfers to other balance sheet accounts.
3 Other includes foreign exchange movements, non-cash additions (including $115 million (2012: $23 million) relating to nance leases (refer to Note 21) and net impairment of property, plant
andequipment.