Qantas 2013 Annual Report Download - page 159
Download and view the complete annual report
Please find page 159 of the 2013 Qantas annual report below. You can navigate through the pages in the report by either clicking on the pages listed below, or by using the keyword search tool below to find specific information within the annual report.-
 1
1 -
2
-
3
-
4
-
5
-
6
-
7
-
8
-
9
-
10
-
11
-
12
-
13
-
14
-
15
-
16
-
17
-
18
-
19
-
20
-
21
-
22
-
23
-
24
-
25
-
26
-
27
-
28
-
29
-
30
-
31
-
32
-
33
-
34
-
35
-
36
-
37
-
38
-
39
-
40
-
41
-
42
-
43
-
44
-
45
-
46
-
47
-
48
-
49
-
50
-
51
-
52
-
53
-
54
-
55
-
56
-
57
-
58
-
59
-
60
-
61
-
62
-
63
-
64
-
65
-
66
-
67
-
68
-
69
-
70
-
71
-
72
-
73
-
74
-
75
-
76
-
77
-
78
-
79
-
80
-
81
-
82
-
83
-
84
-
85
-
86
-
87
-
88
-
89
-
90
-
91
-
92
-
93
-
94
-
95
-
96
-
97
-
98
-
99
-
100
-
101
-
102
-
103
-
104
-
105
-
106
-
107
-
108
-
109
-
110
-
111
-
112
-
113
-
114
-
115
-
116
-
117
-
118
-
119
-
120
-
121
-
122
-
123
-
124
-
125
-
126
-
127
-
128
-
129
-
130
-
131
-
132
-
133
-
134
-
135
-
136
-
137
-
138
-
139
-
140
-
141
-
142
-
143
-
144
-
145
-
146
-
147
-
148
-
 149
149 -
 150
150 -
 151
151 -
 152
152 -
 153
153 -
 154
154 -
 155
155 -
 156
156 -
 157
157 -
 158
158 -
 159
159 -
 160
160 -
 161
161 -
 162
162 -
 163
163 -
 164
164 -
 165
165 -
 166
166 -
 167
167 -
 168
168 -
 169
169 -
170
-
171
-
172
-
173
-
174
-
175
-
176
-
177
-
178
-
179
-
180
-
181
-
182
-
183
-
184
 |
 |
157
QANTAS ANNUAL REPORT 2013
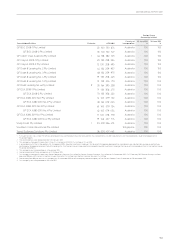
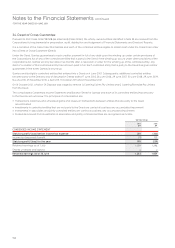
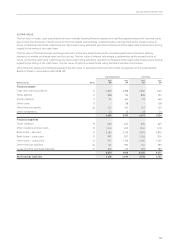
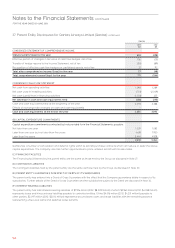
D FAIR VALUE
The fair value of cash, cash equivalents and non-interest-bearing nancial assets and liabilities approximates their carrying value
due to their short maturity. The fair value of nancial assets and liabilities is determined by valuing them at the present value of
future contracted cash ows. Cash ows are discounted using standard valuation techniques at the applicable market yield, having
regard to the timing of the cash ows.
The fair value of forward foreign exchange and fuel contracts is determined as the unrealised gain/loss at balance date by
reference to market exchange rates and fuel prices. The fair value of interest rate swaps is determined as the present value of
future contracted cash ows. Cash ows are discounted using standard valuation techniques at the applicable market yield, having
regard to the timing of the cash ows. The fair value of options is determined using standard valuation techniques.
Other nancial assets and liabilities represent the fair value of derivative nancial instruments recognised on the Consolidated
Balance Sheet in accordance with AASB 139.
Carrying Amount Fair Value
Qantas Group Notes
2013
$M
2012
$M
2013
$M
2012
$M
Financial assets
Cash and cash equivalents 10 2,829 3,398 2,837 3,413
Trade debtors 11 898 794 898 794
Sundry debtors 11 712 661 712 661
Other loans 11 –128 –128
Other nancial assets 26 207 105 207 105
Other investments 23 23 23 23
4,669 5,109 4,677 5,124
Financial liabilities
Trade creditors 19 655 645 655 645
Other creditors and accruals 19 1,204 1,231 1,204 1,231
Bank loans – secured 21 3,285 3,733 3,393 3,870
Bank loans – unsecured 21 992 877 1,056 924
Other loans – unsecured 21 927 1,216 1,065 1,225
Other nancial liabilities 26 140 593 140 593
Lease and hire purchase liabilities 21 876 723 942 789
8,079 9,018 8,455 9,277
Net nancial liabilities 3,410 3,909 3,778 4,153