Qantas 2013 Annual Report Download - page 115
Download and view the complete annual report
Please find page 115 of the 2013 Qantas annual report below. You can navigate through the pages in the report by either clicking on the pages listed below, or by using the keyword search tool below to find specific information within the annual report.-
 1
1 -
2
-
3
-
4
-
5
-
6
-
7
-
8
-
9
-
10
-
11
-
12
-
13
-
14
-
15
-
16
-
17
-
18
-
19
-
20
-
21
-
22
-
23
-
24
-
25
-
26
-
27
-
28
-
29
-
30
-
31
-
32
-
33
-
34
-
35
-
36
-
37
-
38
-
39
-
40
-
41
-
42
-
43
-
44
-
45
-
46
-
47
-
48
-
49
-
50
-
51
-
52
-
53
-
54
-
55
-
56
-
57
-
58
-
59
-
60
-
61
-
62
-
63
-
64
-
65
-
66
-
67
-
68
-
69
-
70
-
71
-
72
-
73
-
74
-
75
-
76
-
77
-
78
-
79
-
80
-
81
-
82
-
83
-
84
-
85
-
86
-
87
-
88
-
89
-
90
-
91
-
92
-
93
-
94
-
95
-
96
-
97
-
98
-
99
-
100
-
101
-
102
-
103
-
104
-
 105
105 -
 106
106 -
 107
107 -
 108
108 -
 109
109 -
 110
110 -
 111
111 -
 112
112 -
 113
113 -
 114
114 -
 115
115 -
 116
116 -
 117
117 -
 118
118 -
 119
119 -
 120
120 -
 121
121 -
 122
122 -
 123
123 -
 124
124 -
 125
125 -
126
-
127
-
128
-
129
-
130
-
131
-
132
-
133
-
134
-
135
-
136
-
137
-
138
-
139
-
140
-
141
-
142
-
143
-
144
-
145
-
146
-
147
-
148
-
149
-
150
-
151
-
152
-
153
-
154
-
155
-
156
-
157
-
158
-
159
-
160
-
161
-
162
-
163
-
164
-
165
-
166
-
167
-
168
-
169
-
170
-
171
-
172
-
173
-
174
-
175
-
176
-
177
-
178
-
179
-
180
-
181
-
182
-
183
-
184
 |
 |

113
QANTAS ANNUAL REPORT 2013
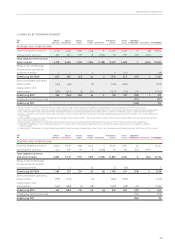
C ANALYSIS BY OPERATING SEGMENT1
2013
$M
Qantas
Domestic
Qantas
International
Qantas
Loyalty
Qantas
Freight Eliminations
Total Qantas
Brands2
Jetstar
Group
Corporate/
Unallocated6Eliminations Consolidated
REVENUE AND OTHER INCOME
External segment revenue
3,4
5,731 4,821 1,096 1,048 9 12,705 3,129 71 (3) 15,902
Intersegment revenue 487 675 109 8 (1,167) 112 159 (70) (201) –
Total segment revenue and
other income 6,218 5,496 1,205 1,056 (1,158) 12,817 3,288 1 (204) 15,902
Share of net prot/(loss)
of associates and jointly
controlled entities554–2–11(50)––(39)
Underlying EBITDAR
7
1,147 495 263 66 3 1,974 543 (171) 1 2,347
Non-cancellable operating
lease rentals (163) (68) – (5) – (236) (289) – – (525)
Depreciation and
amortisation (619) (673) (3) (25) – (1,320) (116) (14) – (1,450)
Underlying EBIT 365 (246) 260 36 3 418 138 (185) 1 372
Underlying net nance costs (180) (180)
Underlying PBT (365) 192
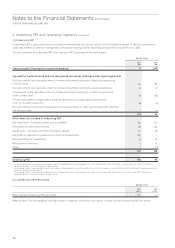
1 Qantas Domestic, Qantas International, Qantas Loyalty, Qantas Freight, Jetstar Group and Corporate/Unallocated are the operating segments of the Qantas Group.
2 Qantas Brands is a cash generating unit comprising those operations of the Qantas Group which are dependent on the Qantas eet and the Qantas brand to collectively generate
cashinows and derive value. Qantas Brands is managed through four operating segments being Qantas Domestic, Qantas International, Qantas Loyalty and Qantas Freight.
3 Includes settlement income of $125 million following the restructure of the Boeing 787 aircraft delivery schedule (reported equally across Qantas Domestic, Qantas International and
Jetstar Group).
4 External segment revenue includes the impact of the change in accounting estimates — passenger revenue of $134 million (Qantas Domestic $80 million and Qantas International
$54 million) as described in Note 1(C).
5 Qantas Domestic and Qantas International’s share of net prot/(loss) of associates and jointly controlled entities amounts to $4.5 million and $4.5 million, respectively.
6 Corporate/Unallocated is the only operating segment with Underlying PBT as the primary reporting measure. The primary reporting measure of other operating segments
is UnderlyingEBIT.
7 Underlying EBITDAR represents Underlying earnings before income tax expense, depreciation, amortisation, non-cancellable aircraft operating lease rentals and net nance costs.
2012
$M
Qantas
Domestic
Qantas
International
Qantas
Loyalty
Qantas
Freight Eliminations
Total Qantas
Brands
Jetstar
Group
Corporate/
Unallocated Eliminations Consolidated
REVENUE AND OTHER INCOME
External segment revenue 5,603 5,079 1,058 1,004 3 12,747 2,915 61 1 15,724
Intersegment revenue 460 691 99 9 (1,168) 91 161 (55) (197) –
Total segment revenue
and other income 6,063 5,770 1,157 1,013 (1,165) 12,838 3,076 6 (196) 15,724
Share of net prot/(loss)
of associates and jointly
controlled entities 3 3 – 16 – 22 (19) – – 3
Underlying EBITDAR 1,186 317 234 67 (6) 1,798 574 (178) 4 2,198
Non-cancellable operating
lease rentals (159) (103) – (4) – (266) (283) – – (549)
Depreciation and
amortisation (564) (698) (3) (18) – (1,283) (88) (13) – (1,384)
Underlying EBIT 463 (484) 231 45 (6) 249 203 (191) 4 265
Underlying net nance costs (170) (170)
Underlying PBT (361) 95