Proctor and Gamble 2006 Annual Report Download - page 69
Download and view the complete annual report
Please find page 69 of the 2006 Proctor and Gamble annual report below. You can navigate through the pages in the report by either clicking on the pages listed below, or by using the keyword search tool below to find specific information within the annual report.-
 1
1 -
2
-
3
-
4
-
5
-
6
-
7
-
8
-
9
-
10
-
11
-
12
-
13
-
14
-
15
-
16
-
17
-
18
-
19
-
20
-
21
-
22
-
23
-
24
-
25
-
26
-
27
-
28
-
29
-
30
-
31
-
32
-
33
-
34
-
35
-
36
-
37
-
38
-
39
-
40
-
41
-
42
-
43
-
44
-
45
-
46
-
47
-
48
-
49
-
50
-
51
-
52
-
53
-
54
-
55
-
56
-
57
-
58
-
 59
59 -
 60
60 -
 61
61 -
 62
62 -
 63
63 -
 64
64 -
 65
65 -
 66
66 -
 67
67 -
 68
68 -
 69
69 -
 70
70 -
 71
71 -
 72
72
 |
 |

The Procter &Gamble Company and Subsidiaries 67
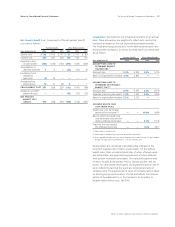
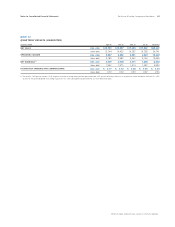
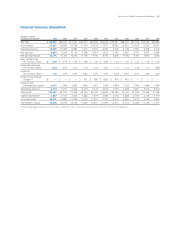
Financial Summary (Unaudited)
Amounts in millions,
except per share amounts 2006 2005 2004 2003 2002 2001 2000 1999 1998 1997 1996
Net Sales $ 68,222 $56,741 $51,407 $43,377 $40,238 $39,244 $39,951 $38,125 $37,154 $35,764 $35,284
Gross Margin 35,097 28,869 26,264 21,155 19,159 17,071 18,395 16,901 16,019 15,229 14,507
Operating Income 13,249 10,469 9,382 7,312 6,073 4,260 5,678 6,130 5,581 5,318 4,716
Net Earnings 8,684 6,923 6,156 4,788 3,910 2,612 3,363 3,683 3,472 3,305 2,981
Net Earnings Margin 12.7% 12.2% 12.0% 11.0% 9.7% 6.7% 8.4% 9.7% 9.3% 9.2% 8.4%
Basic Net Earnings
Per Common Share $2.79$ 2.70 $ 2.34 $ 1.80 $ 1.46 $ 0.96 $ 1.24 $ 1.35 $ 1.25 $ 1.18 $ 1.05
Diluted Net Earnings
Per Common Share 2.64 2.53 2.20 1.70 1.39 0.92 1.17 1.27 1.18 1.10 0.98
Dividends
Per Common Share 1.15 1.03 0.93 0.82 0.76 0.70 0.64 0.57 0.51 0.45 0.40
Restructuring Program
Charges(1) $—$ — $ — $ 751 $ 958 $ 1,850 $ 814 $ 481 $ — $ — $ —
Research and
Development Expense 2,075 1,940 1,802 1,665 1,601 1,769 1,899 1,726 1,546 1,469 1,399
Advertising Expense 6,773 5,917 5,504 4,373 3,773 3,612 3,793 3,639 3,801 3,574 3,374
Total Assets 135,695 61,527 57,048 43,706 40,776 34,387 34,366 32,192 31,042 27,598 27,762
Capital Expenditures 2,667 2,181 2,024 1,482 1,679 2,486 3,018 2,828 2,559 2,129 2,179
Long-Term Debt 35,976 12,887 12,554 11,475 11,201 9,792 9,012 6,265 5,774 4,159 4,678
Shareholders‘ Equity 62,908 18,475 18,190 17,025 14,415 12,560 12,673 12,352 12,493 12,139 11,757
(1) Restructuring program charges, on an after-tax basis, totaled $538, $706, $1,475, $688 and $285 for 2003, 2002, 2001, 2000 and 1999, respectively.