Proctor and Gamble 2006 Annual Report Download - page 59
Download and view the complete annual report
Please find page 59 of the 2006 Proctor and Gamble annual report below. You can navigate through the pages in the report by either clicking on the pages listed below, or by using the keyword search tool below to find specific information within the annual report.-
 1
1 -
2
-
3
-
4
-
5
-
6
-
7
-
8
-
9
-
10
-
11
-
12
-
13
-
14
-
15
-
16
-
17
-
18
-
19
-
20
-
21
-
22
-
23
-
24
-
25
-
26
-
27
-
28
-
29
-
30
-
31
-
32
-
33
-
34
-
35
-
36
-
37
-
38
-
39
-
40
-
41
-
42
-
43
-
44
-
45
-
46
-
47
-
48
-
 49
49 -
 50
50 -
 51
51 -
 52
52 -
 53
53 -
 54
54 -
 55
55 -
 56
56 -
 57
57 -
 58
58 -
 59
59 -
 60
60 -
 61
61 -
 62
62 -
 63
63 -
 64
64 -
 65
65 -
 66
66 -
 67
67 -
 68
68 -
 69
69 -
70
-
71
-
72
 |
 |

Millions of dollars except per share amounts or otherwise specified.
Notes to Consolidated Financial Statements The Procter &Gamble Company and Subsidiaries 57
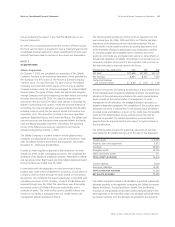
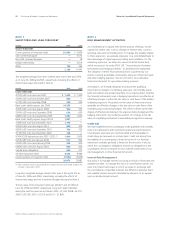
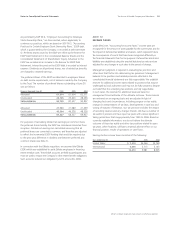
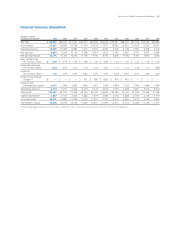
Net Periodic Benefit Cost. Components of the net periodic benefit
cost were as follows:
Pension Benefits Other Retiree Benefits
Years ended June 30 2006 2005 2004 2006 2005 2004
Service cost $ 265 $162 $157 $97 $67 $89
Interest cost 383 241 204 179 146 172
Expected return
on plan assets (353) (185) (153) (372) (333) (329)
Amortization of
deferred amounts 763(22) (22) (1)
Curtailment and
settlement
(gain) loss (4) 13 — ———
Recognized net
actuarial loss 76 31 28 611
GROSS BENEFIT COST 374 268 239 (112) (141) (68)
Dividends on ESOP
preferred stock ———(78) (73) (73)
NET PERIODIC
BENEFIT COST
(CREDIT) 374 268 239 (190) (214) (141)
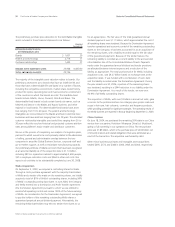
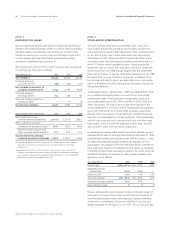
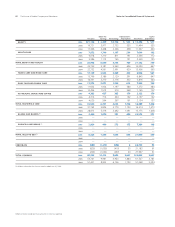
Assumptions. We determine our actuarial assumptions on an annual
basis. These assumptions are weighted to reflect each country that
may have an impact on the cost of providing retirement benefits.
The weighted average assumptions for the defined benefit and other
retiree benefit calculations, as well as assumed health care trend rates
are as follows:
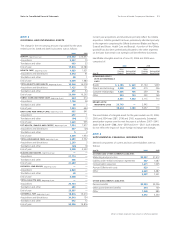
Pension Benefits Other Retiree Benefits
Years ended June 30 2006 2005 2006 2005
ASSUMPTIONS USED TO
DETERMINE BENEFIT
OBLIGATIONS (1)
Discount rate 5.2% 4.5% 6.3% 5.1%
Rate of compensation increase 3.0% 2.8% ——
ASSUMPTIONS USED TO
DETERMINE NET PERIODIC
BENEFIT COST (2)
Discount rate 4.7% 5.2% 5.2% 6.1%
Expected return on plan assets 7.3% 7.2% 9.2% 9.5%
Rate of compensation increase 3.2% 3.1% ——
ASSUMED HEALTH CARE
COST TREND RATES
Health care cost trend rates
assumed for next year(3) ——10.0% 9.6%
Rate to which the health care
cost trend rate is assumed to
decline (ultimate trend rate) ——5.1% 5.1%
Year that the rate reaches
the ultimate trend rate ——2012 2011
(1) Determined as of end of year.
(2) Determined as of beginning of year, and adjusted for acquisitions.
(3) Rate is applied to current plan costs net of Medicare; estimated initial rate for “gross eligible
charges” (charges inclusive of Medicare) is 7.7% for 2006 and 2005.
Several factors are considered in developing the estimate for the
long-term expected rate of return on plan assets. For the defined
benefit plans, these include historical rates of return of broad equity
and bond indices and projected long-term rates of return obtained
from pension investment consultants. The expected long-term rates
of return for plan assets are 8%– 9% for equities and 5% –6% for
bonds. For other retiree benefit plans, the expected long-term rate of
return reflects the fact that the assets are comprised primarily of
Company stock. The expected rate of return on Company stock is based
on the long-term projected return of 9.5% and reflects the historical
pattern of favorable returns on the Company‘s stock relative to
broader market indices (e.g., S&P 500).