Proctor and Gamble 2006 Annual Report Download - page 33
Download and view the complete annual report
Please find page 33 of the 2006 Proctor and Gamble annual report below. You can navigate through the pages in the report by either clicking on the pages listed below, or by using the keyword search tool below to find specific information within the annual report.-
 1
1 -
2
-
3
-
4
-
5
-
6
-
7
-
8
-
9
-
10
-
11
-
12
-
13
-
14
-
15
-
16
-
17
-
18
-
19
-
20
-
21
-
22
-
 23
23 -
 24
24 -
 25
25 -
 26
26 -
 27
27 -
 28
28 -
 29
29 -
 30
30 -
 31
31 -
 32
32 -
 33
33 -
 34
34 -
 35
35 -
 36
36 -
 37
37 -
 38
38 -
 39
39 -
 40
40 -
 41
41 -
 42
42 -
 43
43 -
44
-
45
-
46
-
47
-
48
-
49
-
50
-
51
-
52
-
53
-
54
-
55
-
56
-
57
-
58
-
59
-
60
-
61
-
62
-
63
-
64
-
65
-
66
-
67
-
68
-
69
-
70
-
71
-
72
 |
 |
The Procter &Gamble Company and Subsidiaries 31Management’s Discussion and Analysis
Net Earnings
In 2006, net earnings increased 25% to $8.68 billion. Net earnings
increased primarily behind the addition of Gillette as well as sales
growth and margin expansion on our base business. Net earnings
margin expanded 50-basis points as scale leverage from volume growth,
price increases and cost savings projects more than offset higher
commodity costs and acquisition-related expenses. In 2005, net earnings
increased 12% to $6.92 billion. Earnings grew primarily behind
volume growth and cost reduction efforts, which more than offset the
effects of higher commodity costs and increased marketing spending.
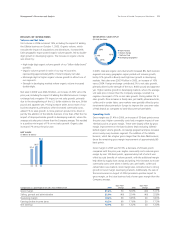
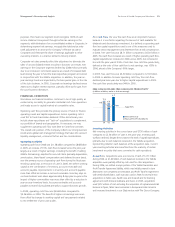
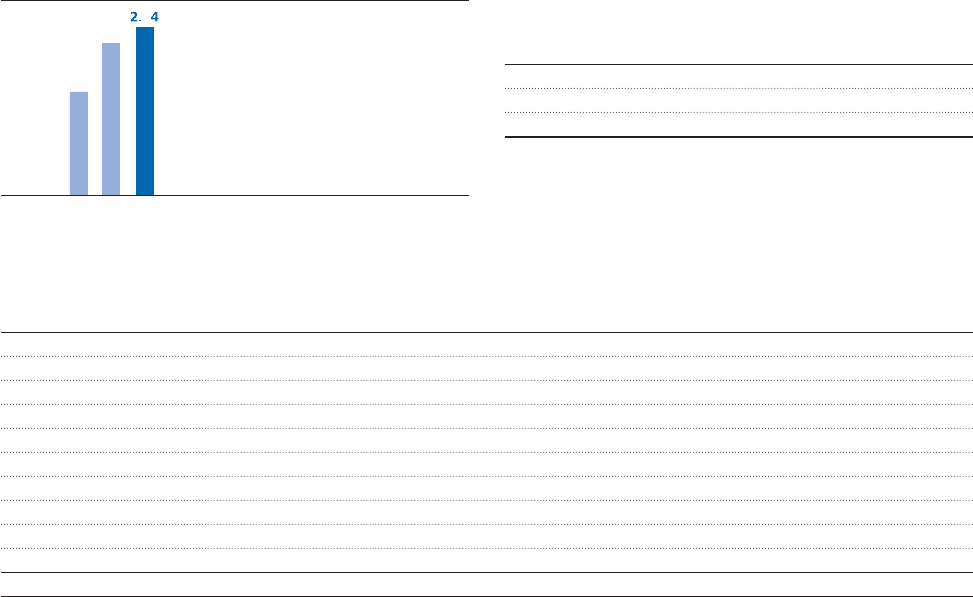
Diluted net earnings per share in 2006 were $2.64, an increase of 4%
versus the prior year. The Gillette acquisition had a dilutive impact on
our earnings per share of $0.20 – $0.23, which reduced earnings per
share growth by 8%–9% for the fiscal year. When we acquired Gillette
in October 2005, we exchanged 0.975 common shares of P&Gstock
for each share of Gillette stock. This increased the number of P&G
common shares outstanding by 962 million shares. The dilutive impact
of the additional shares and incremental acquisition-related expenses
was partially offset by the addition of Gillette’s earnings, initial cost
and revenue synergies and by our share repurchase activity. During the
year, we repurchased a total of $16.8 billion of P&G shares. In 2005,
diluted net earnings per share were $2.53, an increase of 15% compared
to the prior year. Diluted net earnings per share grew ahead of net
earnings in 2005 due to the Company’s share repurchase activity.
DILUTED NET EARNINGS
(per common share)
05
2.53
04
2.20
06
6
SEGMENT RESULTS
Results for the segments reflect information on the same basis we use
for internal management reporting and performance evaluation. These
results exclude certain costs included in the Consolidated Financial
Statements (e.g., interest expense, other financing costs, investing
activities and certain restructuring costs), which are reported in
Corporate. Within the Beauty and Health GBU, we provide data for
the Beauty and the Health Care reportable segments. In the Household
Care GBU, we provide data for the Fabric Care and Home Care, the
Baby Care and Family Care and the Pet Health, Snacks and Coffee
reportable segments. In the Gillette GBU, we provide data for the
Blades and Razors and the Duracell and Braun reportable segments.
As described in Note 12 to the Consolidated Financial Statements, we
have investments in certain companies over which we exert significant
influence, but do not control the financial and operating decisions and,
therefore, do not consolidate them (“unconsolidated entities”). Because
certain of these investments are managed as integral parts of the
Company‘s business units, they are accounted for as if they were
consolidated subsidiaries for management and segment reporting
purposes. This means pretax earnings in the business units include
100% of each pretax income statement component. In determining
after-tax earnings in the business units, we eliminate the share of
earnings applicable to other ownership interests, in a manner similar
to minority interest, and apply the statutory tax rates. Eliminations to
adjust each line item to U.S. GAAP are included in Corporate.
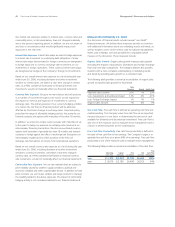
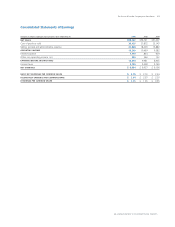
Beauty and Health
BEAUTY
Change vs. Change vs.
(in millions of dollars) 2006 Prior Year 2005 Prior Year
Volume*n/a +8% n/a +12%
Net Sales*$21,126 +7% $19,721 +14%
Net Earnings*$ 3,106 +13% $ 2,752 +23%
* Fiscal 2006 figures include results of Gillette personal care for the 9 months ended June 30, 2006.
Beauty unit volume increased 8% in 2006, including nine months of
Gillette personal care results. Organic volume, which excludes the
impact of acquisitions and divestitures, increased 6%. Volume growth
Volume
Volume with excluding
Acquisitions Acquisitions Foreign Net Sales Net Sales
Net Sales Change Drivers vs. Year Ago (2006 vs. 2005) &Divestitures &Divestitures Exchange Price Mix/Other Growth Growth ex-FX
BEAUTY AND HEALTH
Beauty 8%6%-1%0%0%7%8%
Health Care 26% 7% -1% 2% 2% 29% 30%
HOUSEHOLD CARE
Fabric Care and Home Care 8% 7% -1% 2% 0% 9% 10%
Baby Care and Family Care 3% 4% -1% 2% -1% 3% 4%
PetHealth,SnacksandCoffee 0%0%0%2%0%2%2%
GILLETTE GBU
Blades and Razors n/a n/a n/a n/a n/a n/a n/a
Duracell and Braun n/a n/a n/a n/a n/a n/a n/a
TOTAL COMPANY 19% 6% -1% 1% 1% 20% 21%
Sales percentage changes are approximations based on quantitative formulas that are consistently applied. Total company mix impact of 1% is driven largely by the addition of Gillette.