Proctor and Gamble 2006 Annual Report Download - page 35
Download and view the complete annual report
Please find page 35 of the 2006 Proctor and Gamble annual report below. You can navigate through the pages in the report by either clicking on the pages listed below, or by using the keyword search tool below to find specific information within the annual report.-
 1
1 -
2
-
3
-
4
-
5
-
6
-
7
-
8
-
9
-
10
-
11
-
12
-
13
-
14
-
15
-
16
-
17
-
18
-
19
-
20
-
21
-
22
-
23
-
24
-
 25
25 -
 26
26 -
 27
27 -
 28
28 -
 29
29 -
 30
30 -
 31
31 -
 32
32 -
 33
33 -
 34
34 -
 35
35 -
 36
36 -
 37
37 -
 38
38 -
 39
39 -
 40
40 -
 41
41 -
 42
42 -
 43
43 -
 44
44 -
 45
45 -
46
-
47
-
48
-
49
-
50
-
51
-
52
-
53
-
54
-
55
-
56
-
57
-
58
-
59
-
60
-
61
-
62
-
63
-
64
-
65
-
66
-
67
-
68
-
69
-
70
-
71
-
72
 |
 |

The Procter &Gamble Company and Subsidiaries 33Management’s Discussion and Analysis
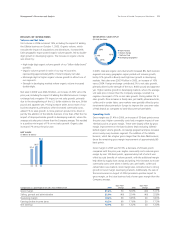
Net earnings increased 11% to $2.37 billion primarily behind volume
increases. Margin also improved by 35-basis points as volume growth,
price increases and cost savings initiatives more than offset commodity
cost increases. Overhead and marketing spending increased year-on-
year in absolute, but were down slightly as a percentage of net sales.
Unit volume in 2005 increased by 9% in Fabric Care and Home Care.
Both fabric care and home care delivered high-single digit growth.
Unit volume increased behind initiative activity, expansion of the
portfolio to serve more consumers and continued growth in developing
markets. Acquisitions in Europe and Latin America contributed 2% to
volume growth. Developing markets grew unit volume by double-
digits, led by the continued success of Tide in Greater China. Net sales
in 2005 increased 10% to $15.80 billion. Foreign exchange added 2%
to sales growth. The mix impact of higher relative growth in developing
markets reduced sales by 1%. Net earnings were $2.13 billion, a
decrease of 2% compared to the prior year. After-tax earnings margin
decreased 170-basis points primarily due to higher commodity costs,
which more than offset the scale benefits of volume growth and
pricing actions in certain markets. Additionally, after-tax margin in 2005
was lower due to the mix effect of higher growth rates in developing
markets, where the margins are lower than in developed markets.
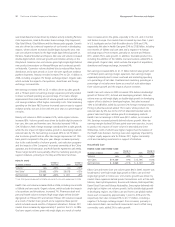
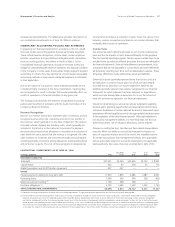
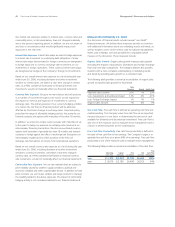
BABY CARE AND FAMILY CARE
Change vs. Change vs.
(in millions of dollars) 2006 Prior Year 2005 Prior Year
Volume n/a +3% n/a +7%
Net Sales $11,972 +3% $11,652 +11%
Net Earnings $ 1,299 +9% $ 1,197 +30%
Baby Care and Family Care volume increased 3% in 2006, with
organic volume up 4%. Baby care unit volume increased in the mid-
single digits led by double-digit increases in developing regions,
primarily behind 5 points of market share growth in Greater China
and more than 2 points of share growth in Central &Eastern Europe/
Middle East/Africa. In developed regions, baby care volume declined
slightly as growth on Pampers Baby Stages of Development and
KandoowasmorethanoffsetbysoftnessonBabyDryaswellason
Luvs in North America, primarily due to pricing pressure from private
label competitors. Family care organic volume grew in the mid-single
digits, largely behind growth on the Bounty and Charmin Basic
initiative. Net sales in the Baby Care and Family Care segment were
$11.97 billion, up 3%, including a negative 1% foreign exchange
impact. Price increases in North America baby care, coupled with a
late January increase in North America family care, added 2% to sales
growth. Disproportionate growth in mid-tier products and in developing
regions, where average unit selling price is below the segment average,
resulted in a negative 1% mix impact on segment sales.
Baby Care and Family Care net earnings increased 9% to $1.30 billion
behind sales growth and a 60-basis point earnings margin improvement.
Scale benefits of volume growth and price increases more than offset
the increase in commodity and energy costs. In addition, SG&A
declined as a percentage of net sales due to reductions in both overhead
and marketing spending as a percentage of sales. These reductions
were driven by scale benefits from current year volume growth and
significant investments in the base period behind initiative launches.
Baby Care and Family Care unit volume increased 7% in 2005. Baby
care unit volume increased high-single digits behind a continued
stream of innovation including Feel ’n Learn training pants in North
America, Baby Dry fit upgrade and Baby Stages of Development
upgrades in Western Europe and the expansion of Pampers Kandoo.
Family care volume increased mid-single digits driven by product,
packaging and format initiatives in North America on both the Bounty
and Charmin brands. Net sales increased 11% to $11.65 billion,
including a positive 3% impact from foreign exchange. Pricing added
1% to sales growth driven primarily by a price increase in North America
family care to recover higher commodity costs, partially offset by
targeted pricing investments in Western Europe in response to
competitive activity. Net earnings increased 30% to $1.20 billion
behind volume gains and an increase in after-tax earnings margin of
150-basis points to 10.3%, driven by scale benefits, pricing and cost
savings projects.
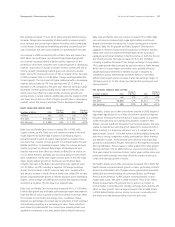
PET HEALTH, SNACKS AND COFFEE
Change vs. Change vs.
(in millions of dollars) 2006 Prior Year 2005 Prior Year
Volume n/a 0% n/a +2%
Net Sales $4,383 +2% $4,314 +7%
Net Earnings $ 385 -13% $ 444 +21%
Pet Health, Snacks and Coffee unit volume was flat in 2006 despite a
high-single digit decline in our coffee unit volume caused by shipment
disruptions following Hurricane Katrina in August 2005. Our primary
coffee manufacturing and warehousing facilities, located in New
Orleans, incurred significant disruption from Hurricane Katrina. We were
unable to manufacture and ship at full capacity for several months in
2006, resulting in a temporary decline in our U.S. market share of
approximately 2 points. Pet health volume declined slightly during the
year due to strong competitive activity, particularly in North America
and Western Europe. These declines were offset by mid-single digit
growth in snacks behind Pringles. Net sales for the segment increased
2% to $4.38 billion. Price increases in coffee added 2% to sales growth.
Earnings declined 13% to $385 million as costs incurred during the
fiscal year related to Hurricane Katrina, higher green coffee prices and
lower pet health earnings more than offset the impact of pricing in
coffee and earnings growth in snacks.
Pet Health, Snacks and Coffee unit volume increased 2% in 2005. Pet
health volume increased behind growth on Iams, particularly in North
America and Northeast Asia. Pringles volume grew behind expanded
distribution and merchandizing of customized flavors and Pringles
Prints in North America. Coffee volume increased behind custom
Folgers dark roasts. Net sales in 2005 increased 7% to $4.31 billion.
Pricing increased sales 3% primarily due to actions on Folgers to
recover higher commodity costs. Foreign exchange had a positive 2%
effect on sales growth. Net earnings increased 21% to $444 million
in 2005 behind higher volume, pricing to recover commodity costs
and lower merchandising spending versus the prior year.