Proctor and Gamble 2006 Annual Report Download - page 56
Download and view the complete annual report
Please find page 56 of the 2006 Proctor and Gamble annual report below. You can navigate through the pages in the report by either clicking on the pages listed below, or by using the keyword search tool below to find specific information within the annual report.-
 1
1 -
2
-
3
-
4
-
5
-
6
-
7
-
8
-
9
-
10
-
11
-
12
-
13
-
14
-
15
-
16
-
17
-
18
-
19
-
20
-
21
-
22
-
23
-
24
-
25
-
26
-
27
-
28
-
29
-
30
-
31
-
32
-
33
-
34
-
35
-
36
-
37
-
38
-
39
-
40
-
41
-
42
-
43
-
44
-
45
-
 46
46 -
 47
47 -
 48
48 -
 49
49 -
 50
50 -
 51
51 -
 52
52 -
 53
53 -
 54
54 -
 55
55 -
 56
56 -
 57
57 -
 58
58 -
 59
59 -
 60
60 -
 61
61 -
 62
62 -
 63
63 -
 64
64 -
 65
65 -
 66
66 -
67
-
68
-
69
-
70
-
71
-
72
 |
 |

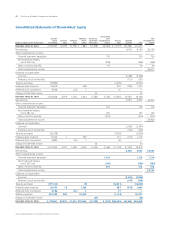
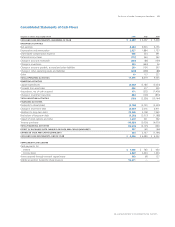
Millions of dollars except per share amounts or otherwise specified.
Notes to Consolidated Financial Statements
The Procter &Gamble Company and Subsidiaries
54
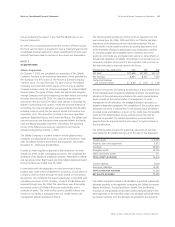
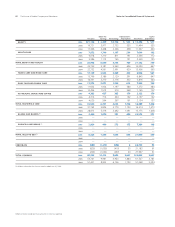
NOTE 7
EARNINGS PER SHARE
Net earnings less preferred dividends (net of related tax benefits) are
divided by the weighted average number of common shares outstanding
during the year to calculate basic net earnings per common share.
Diluted net earnings per common share are calculated to give effect
to stock options and other stock-based awards and assuming
conversion of preferred stock (see Note 9).
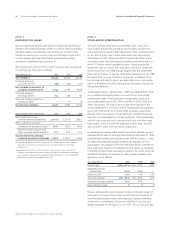
Net earnings and common shares used to calculate basic and diluted
net earnings per share were as follows:
Years ended June 30 2006 2005 2004
NET EARNINGS $8,684 $6,923 $6,156
Preferred dividends,
net of tax benefit (148) (136) (131)
NET EARNINGS AVAILABLE TO
COMMON SHAREHOLDERS 8,536 6,787 6,025
Preferred dividends,
net of tax benefit 148 136 131
Preferred dividend impact on
funding of ESOP —(1) (4)
DILUTED NET EARNINGS 8,684 6,922 6,152
Shares in millions; Years ended June 30 2006 2005 2004
Basic weighted average
common shares outstanding 3,054.9 2,515.6 2,580.1
Effect of dilutive securities
Conversion of preferred shares (1) 154.1 158.3 164.0
Exercise of stock options and
other unvested equity awards (2) 76.9 63.2 55.3
DILUTED WEIGHTED AVERAGE
COMMON SHARES OUTSTANDING 3,285.9 2,737.1 2,799.4
(1) Despite being included currently in diluted net earnings per common share, the actual
conversion to common stock occurs pursuant to the repayment of the ESOP debt
through 2021.
(2) Approximately 44 million in 2006, 48 million in 2005 and 43 million in 2004 of the
Company’s outstanding stock options were not included in the diluted net earnings per
share calculation because to do so would have been antidilutive (i.e., the total proceeds
upon exercise would have exceeded market value).
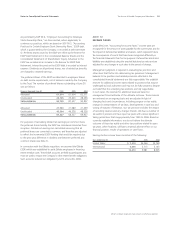
NOTE 8
STOCK-BASED COMPENSATION
We have a primary stock-based compensation plan under which
stock options are granted annually to key managers and directors
with exercise prices equal to the market price of the underlying shares
onthedateofgrant.Grantsweremadeunderplansapprovedby
shareholders in 2001, 2003 and 2004. A total of 249 million shares
of common stock were authorized for issuance under these plans of
which 123 million remain available for grant. Grants issued since
September 2002 are vested after three years and have a 10-year life.
Grants issued from July 1998 through August 2002 are vested after
three years and have a 15-year life, while grants issued prior to July 1998
are vested after one year and have a 10-year life. In addition to our
key manager and director grants, we make other minor stock option
grants to employees for which vesting terms and option lives are not
substantially different.
As discussed in Note 1, effective July 1, 2005, we adopted SFAS 123(R)
on a modified retrospective basis to account for our stock-based
compensation plans. Total stock-based compensation expense for
stock option grants was $526, $459 and $445 for 2006, 2005 and
2004, respectively. The total income tax benefit recognized in the
income statement for these stock-based compensation arrangements
was $140, $125 and $120 for 2006, 2005 and 2004, respectively.
We also make minor grants of restricted stock, restricted stock units
and other stock-based grants to certain employees. Total compensation
cost for these restricted stock, restricted stock units and other stock-
based grants, which are generally expensed at grant date, was $59,
$65 and $46 in 2006, 2005 and 2004, respectively.
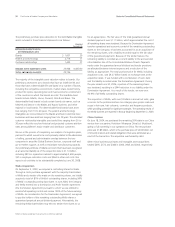
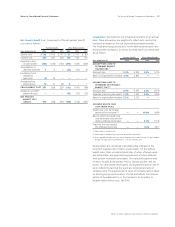
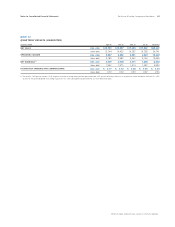
In calculating the compensation expense for options granted, we have
estimated the fair value of each grant issued through December 31, 2004
using the Black-Scholes option-pricing model. Effective January 1, 2005,
we utilize a binomial lattice-based model for the valuation of stock
option grants. The utilization of the binomial lattice-based model did not
have a significant impact on the valuation of stock options as compared
to the Black-Scholes model. Assumptions utilized in the model, which are
evaluated and revised, as necessary, to reflect market conditions and
experience, are as follows:
Years ended June 30 2006 2005 2004
Interest rate 4.5%–4.7% 3.2% – 4.5% 3.8%
Weighted average
interest rate 4.6% 4.4% —
Dividend yield 1.9% 1.9% 1.8%
Expected volatility 15%– 20% 15% – 20% 20%
Weighted average volatility 19% 20% —
Expected life in years 998
Because lattice-based option valuation models incorporate ranges of
assumptions for inputs, those ranges are disclosed for the period of
time that lattice-based models were employed. Expected volatilities
are based on a combination of historical volatility of our stock and
implied volatilities of call options on our stock. We use historical data