Proctor and Gamble 2006 Annual Report Download - page 60
Download and view the complete annual report
Please find page 60 of the 2006 Proctor and Gamble annual report below. You can navigate through the pages in the report by either clicking on the pages listed below, or by using the keyword search tool below to find specific information within the annual report.-
 1
1 -
2
-
3
-
4
-
5
-
6
-
7
-
8
-
9
-
10
-
11
-
12
-
13
-
14
-
15
-
16
-
17
-
18
-
19
-
20
-
21
-
22
-
23
-
24
-
25
-
26
-
27
-
28
-
29
-
30
-
31
-
32
-
33
-
34
-
35
-
36
-
37
-
38
-
39
-
40
-
41
-
42
-
43
-
44
-
45
-
46
-
47
-
48
-
49
-
 50
50 -
 51
51 -
 52
52 -
 53
53 -
 54
54 -
 55
55 -
 56
56 -
 57
57 -
 58
58 -
 59
59 -
 60
60 -
 61
61 -
 62
62 -
 63
63 -
 64
64 -
 65
65 -
 66
66 -
 67
67 -
 68
68 -
 69
69 -
 70
70 -
71
-
72
 |
 |

Millions of dollars except per share amounts or otherwise specified.
Notes to Consolidated Financial Statements
The Procter &Gamble Company and Subsidiaries
58
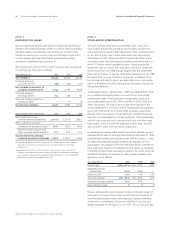
Assumed health care cost trend rates could have a significant effect
on the amounts reported for the other retiree benefit plans. A one-
percentage point change in assumed health care cost trend rates
would have the following effects:
One-Percentage One-Percentage
Point Increase Point Decrease
Effect on total of service and interest
cost components $ 57 $ (41)
Effect on postretirement benefit obligation 484 (371)
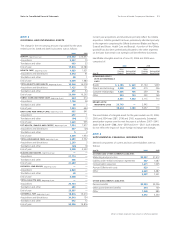
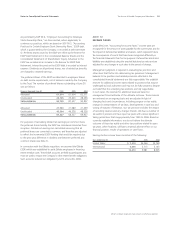
Plan Assets. Our target asset allocation for the year ending
June 30, 2007 and actual asset allocation by asset category as of
June 30, 2006, and 2005, are as follows:
Target Asset Allocation
Asset Category Pension Benefits Other Retiree Benefits
Equity securities(1) 51% 96%
Debt securities 47% 4%
Real estate 2% —
TOTAL 100% 100%
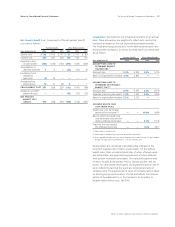
Actual Asset Allocation at June 30
Pension Benefits Other Retiree Benefits
Asset Category 2006 2005 2006 2005
Equity securities(1) 59% 64% 96% 99%
Debt securities 39% 33% 4% 1%
Real estate 2% 3% ——
TOTAL 100% 100% 100% 100%
(1) Equity securities for other retiree plan assets include Company stock, net of Series B ESOP
debt (see Note 5), of $2,693 and $2,604 as of June 30, 2006 and 2005, respectively.
Our investment objective for defined benefit plan assets is to meet
the plans‘ benefit obligations, while minimizing the potential for
future required Company plan contributions. The investment
strategies focus on asset class diversification, liquidity to meet benefit
payments and an appropriate balance of long-term investment return
and risk. Target ranges for asset allocations are determined by
matching the actuarial projections of the plans‘ future liabilities and
benefit payments with expected long-term rates of return on the
assets, taking into account investment return volatility and
correlations across asset classes. Plan assets are diversified across
several investment managers and are generally invested in liquid
funds that are selected to track broad market equity and bond
indices. Investment risk is carefully controlled with plan assets
rebalanced to target allocations on a periodic basis and continual
monitoring of investment managers’ performance relative to the
investment guidelines established with each investment manager.
Cash Flows. Management‘s best estimate of our cash requirements
for the defined benefit plans and other retiree benefit plans for the
year ending June 30, 2007 is $398 and $24, respectively. For the
defined benefit plans, this is comprised of $137 in expected benefit
payments from the Company directly to participants of unfunded
plans and $261 of expected contributions to funded plans. For other
retiree benefit plans, this is comprised of expected contributions that
will be used directly for benefit payments. Expected contributions are
dependent on many variables, including the variability of the market
value of the plan assets as compared to the benefit obligation and
other market or regulatory conditions. In addition, we take into
consideration our business investment opportunities and resulting
cash requirements. Accordingly, actual funding may differ significantly
from current estimates.
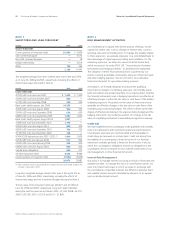
Total benefit payments expected to be paid to participants, which
include payments funded from the Company‘s assets, as discussed
above, as well as payments paid from the plans, are as follows:
Other
Years ended June 30 Pension Benefits Retiree Benefits
Expected benefit payments
2007 $ 399 $ 190
2008 407 207
2009 405 223
2010 414 237
2011 426 251
2012 – 2016 2,337 1,367
Employee Stock Ownership Plan
We maintain the ESOP to provide funding for certain employee
benefits discussed in the preceding paragraphs.
The ESOP borrowed $1.00 billion in 1989 and the proceeds were
used to purchase Series A ESOP Convertible Class A Preferred Stock
to fund a portion of the defined contribution retirement plan in the
U.S. Principal and interest requirements of the borrowing were paid
by the Trust from dividends on the preferred shares and from advances
from the Company. The final payment for the original borrowing of
$1.00 billion was made in 2004. Advances from the Company of
$237 remain outstanding at June 30, 2006. Each share is convertible
at the option of the holder into one share of the Company‘s
common stock. The dividend for the current year was $1.15 per
share. The liquidation value is $6.82 per share.
In 1991, the ESOP borrowed an additional $1.00 billion. The proceeds
were used to purchase Series B ESOP Convertible Class A Preferred
Stock to fund a portion of retiree health care benefits. These shares,
net of the ESOP’s debt, are considered plan assets of the Other Retiree
Benefits plan discussed above. Debt service requirements are funded
by preferred stock dividends, cash contributions and advances from
the Company, of which $51 is outstanding at June 30, 2006. Each
share is convertible at the option of the holder into one share of the
Company‘s common stock. The dividend for the current year was
$1.15 per share. The liquidation value is $12.96 per share.