Proctor and Gamble 2006 Annual Report Download - page 4
Download and view the complete annual report
Please find page 4 of the 2006 Proctor and Gamble annual report below. You can navigate through the pages in the report by either clicking on the pages listed below, or by using the keyword search tool below to find specific information within the annual report.-
 1
1 -
 2
2 -
 3
3 -
 4
4 -
 5
5 -
 6
6 -
 7
7 -
 8
8 -
 9
9 -
 10
10 -
 11
11 -
 12
12 -
 13
13 -
 14
14 -
 15
15 -
16
-
17
-
18
-
19
-
20
-
21
-
22
-
23
-
24
-
25
-
26
-
27
-
28
-
29
-
30
-
31
-
32
-
33
-
34
-
35
-
36
-
37
-
38
-
39
-
40
-
41
-
42
-
43
-
44
-
45
-
46
-
47
-
48
-
49
-
50
-
51
-
52
-
53
-
54
-
55
-
56
-
57
-
58
-
59
-
60
-
61
-
62
-
63
-
64
-
65
-
66
-
67
-
68
-
69
-
70
-
71
-
72
 |
 |

The Procter &Gamble Company and Subsidiaries
2
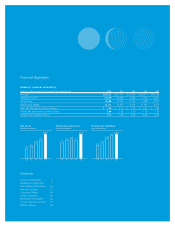
Fiscal 2006 Results
P&G’s performance in fiscal 2006 demonstrated the Company’s
ability to sustain growth. We increased net sales 20% to more
than $68 billion; organic sales increased 7%(1)
. Every business
segment delivered year-on-year organic sales growth; Fabric Care
and Home Care, Beauty, and Health Care delivered the strongest
growth, each growing sales ahead of the Company’s post-Gillette
4% to 6% organic top-line goal. Every geographic region posted
organic volume and sales growth, led by double-digit growth in
developing markets.
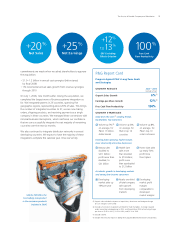
Earnings per share increased 4% to $2.64, despite a -8% to -9%
impact from Gillette dilution, which is slightly better than the
dilution guidance we provided when we completed the
acquisition in October 2005. Excluding Gillette dilution, P&G
earnings per share were up 12% to 13%(2)
, ahead of the 10%+
long-term goal. Net earnings increased 25% to $8.7 billion,
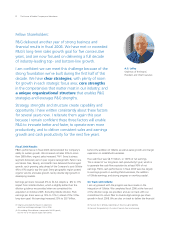
Fellow Shareholders:
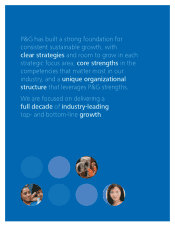
P&G delivered another year of strong business and
financial results in fiscal 2006. We have met or exceeded
P&G’s long-term sales growth goal for five consecutive
years, and are now focused on delivering a full decade
of industry-leading top- and bottom-line growth.
I am confident we can meet this challenge because of the
strong foundation we’ve built during the first half of this
decade. We have clear strategies, with plenty of room
for growth in each strategic focus area; core strengths
in the competencies that matter most in our industry; and
a unique organizational structure that enables P&G
strategies and leverages P&G strengths.
Strategy, strengths and structure create capability and
opportunity. I have written consistently about these factors
for several years now. I reiterate them again this year
because I remain confident these three factors will enable
P&G to innovate better and faster, to operate even more
productively, and to deliver consistent sales and earnings
growth and cash productivity for the next five years.
A.G. Lafley
Chairman of the Board,
President and Chief Executive
behind the addition of Gillette as well as sales growth and margin
expansion on established businesses.
Free cash flow was $8.7(3) billion, or 100% of net earnings.
This is ahead of our long-term cash productivity(4) goal, which is
to generate free cash flow equivalent to at least 90% of net
earnings. P&G’s cash performance in fiscal 2006 was due largely
to earnings growth on existing P&G businesses, the addition
of Gillette earnings, and strong progress on working capital.
On Track with Gillette
I am very pleased with the progress we have made on the
integration of Gillette. We completed fiscal 2006 at the low end
of the dilution range we provided, and are on track with our
commitment to return P&G to double-digit earnings-per-share
growth in fiscal 2008. We are also on track to deliver the financial
(1) Organic sales exclude the impacts of acquisitions,
divestitures and foreign exchange (13% in 2006).
(2) EPS excluding Gillette dilution is comprised of 4% EPS growth,
less the -8% to -9% dilution impact from Gillette.
(3) Free cash flow is defined as operating cash flow less capital spending.
(4) Free cash flow productivity is the ratio of free cash flow to net earnings.