Proctor and Gamble 2006 Annual Report Download - page 5
Download and view the complete annual report
Please find page 5 of the 2006 Proctor and Gamble annual report below. You can navigate through the pages in the report by either clicking on the pages listed below, or by using the keyword search tool below to find specific information within the annual report.-
 1
1 -
 2
2 -
 3
3 -
 4
4 -
 5
5 -
 6
6 -
 7
7 -
 8
8 -
 9
9 -
 10
10 -
 11
11 -
 12
12 -
 13
13 -
 14
14 -
 15
15 -
 16
16 -
17
-
18
-
19
-
20
-
21
-
22
-
23
-
24
-
25
-
26
-
27
-
28
-
29
-
30
-
31
-
32
-
33
-
34
-
35
-
36
-
37
-
38
-
39
-
40
-
41
-
42
-
43
-
44
-
45
-
46
-
47
-
48
-
49
-
50
-
51
-
52
-
53
-
54
-
55
-
56
-
57
-
58
-
59
-
60
-
61
-
62
-
63
-
64
-
65
-
66
-
67
-
68
-
69
-
70
-
71
-
72
 |
 |

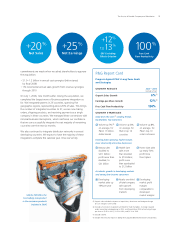
The Procter &Gamble Company and Subsidiaries 3
Gillette FUSION is the
best-selling new product
in the consumer products
industry in 2006
20%
Net Sales
commitments we made when we asked shareholders to approve
the acquisition:
• $1.0–1.2 billion in annual cost synergies (before taxes)
by fiscal 2008
• 1% incremental annual sales growth from revenue synergies
through 2010
On July 1, 2006, nine months after closing the acquisition, we
completed the largest wave of business systems integration so
far. We integrated systems in 26 countries, spanning five
geographic regions, representing about 20% of sales. This brings
the number of integrated countries to 31; we are now taking
orders, shipping products, and receiving payments as a single
company in these countries. We managed these conversions with
minimal business interruptions, which reinforces our confidence
that we can successfully integrate the vast majority of remaining
countries over the next six months.
We also continued to integrate distributor networks in several
developing countries. We expect to have the majority of these
integrations complete this calendar year. Once we’ve fully
25%
Net Earnings 10 0 %
Free Cash
Flow Productivity
12%
to13%
EPS Excluding
Gillette Dilution
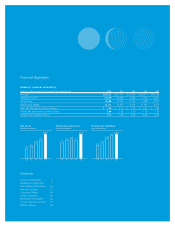
P&G Report Card
Progress Against P&G’s Long-Term Goals
and Strategies
GROWTH RESULTS 2001 – 2006
(average annual)
Organic Sales Growth 6%(5)
Earnings-per-Share Growth 12%(6)
Free Cash Flow Productivity 124%
GROWTH STRATEGIES
Develop faster-growing, higher-margin,
more structurally attractive businesses
Accelerate growth in developing markets
and among low-income consumers
Volume up 7%,(8)
on average, for
P&G’s 17 billion-
dollar brands
Volume up 8%,
on average, for
P&G’s top 16
countries
Volume up 8%,
on average, for
P&G’s top 10
retail customers
Beauty sales
doubled to
$21.1 billion;
profit more than
doubled, to
$3.1 billion
Health Care
sales more
than doubled
to $7.9 billion;
profit more
than quadrupled
to $1.2 billion
Home Care sales
up nearly 70%;
profit more
than tripled
Developing
market sales up
16% per year
Nearly one-third
of total-company
sales growth
from developing
markets
Developing
market profit
margins
comparable to
developed
market margins
++ +
(5) Organic sales exclude the impacts of acquisitions, divestitures and foreign exchange
(6% on average in 2001-2006).
(6) Excludes amortization of goodwill and indefinite-lived intangibles, no longer required
under accounting rules beginning in 2002, and Organization 2005 restructuring charges
per share of $0.61 in 2001, $0.26 in 2002, and $0.19 in 2003.
(7) Excludes Gillette.
(8) Excludes the initial-year impact of adding newly acquired billion-dollar brands to the portfolio.
.
Grow from the core:(7) Leading Brands,
Big Markets, Top Customers